TraceRoot CLI: talk to your traces from your coding agent
The TraceRoot CLI puts your traces where the work already happens: in the coding agent's terminal, not a browser tab.
 Xinwei He
The trace viewer is where you look. The work happens where the code is. The TraceRoot CLI puts the two in the same place.
A run went wrong in production at 14:12. The trace viewer shows 31 spans, 5 of them red, and the person who can fix it is in a Claude Code session with the repo open, not in a browser tab.
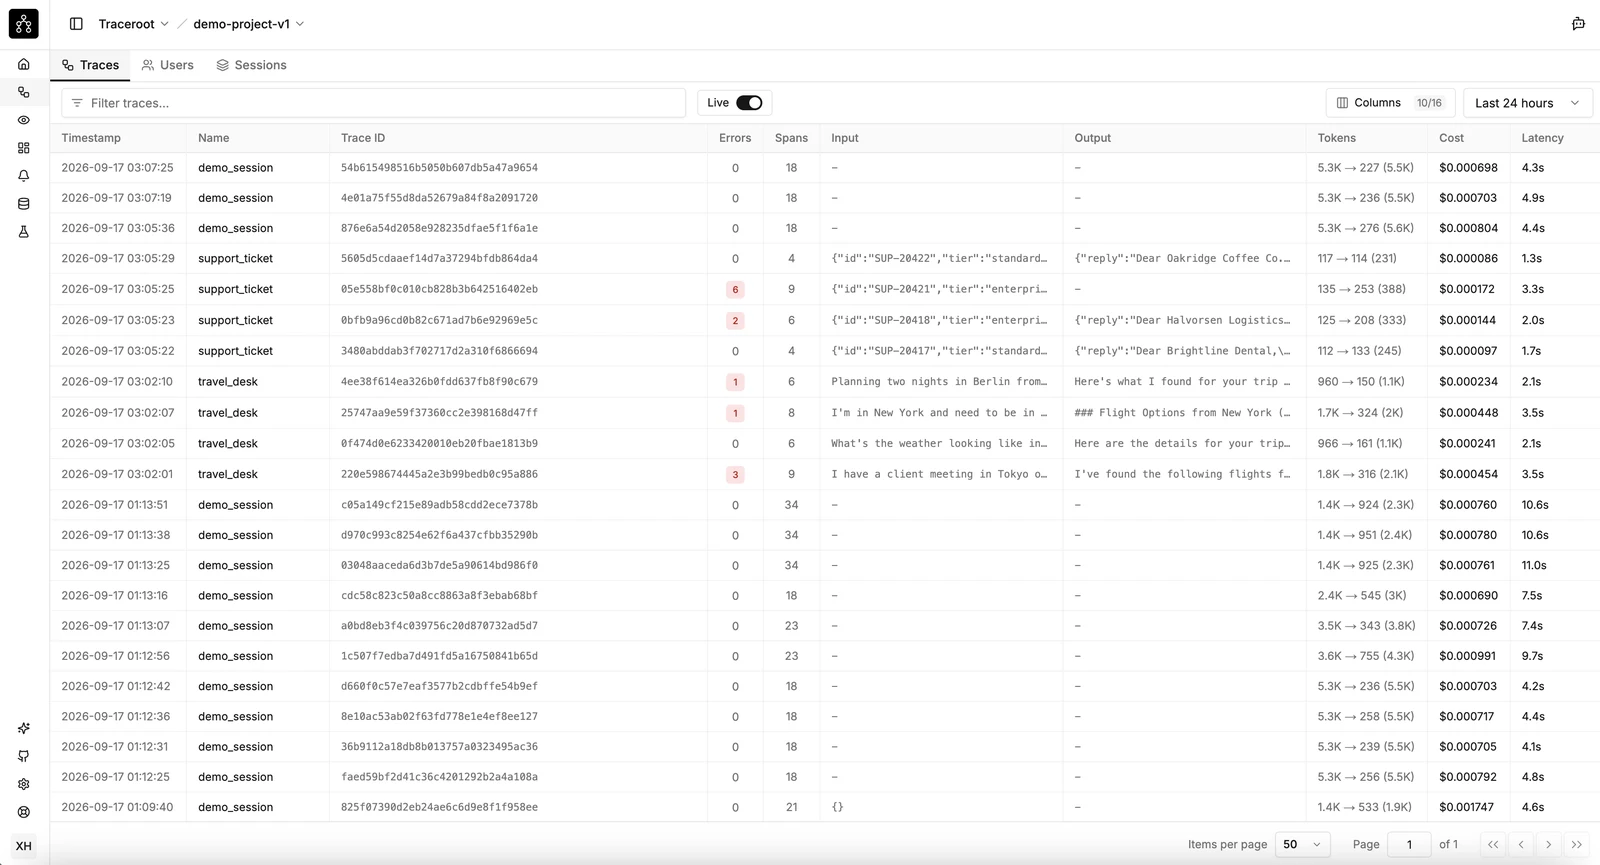
That gap is where most of the time goes. The evidence lives in the observability tool. The change happens in the editor. Someone carries the evidence across by hand, one span at a time, usually from memory, and by the time it arrives it is a paraphrase.
The TraceRoot CLI closes that gap. The coding agent you already have reads the traces itself, whether the question is an error, a hallucination, or a run that was slow and expensive:
Use the traceroot CLI to analyze the last 4 hours of traffic. Where does the agent fail or hallucinate? Give me a fix to improve it.
Watch it run traceroot traces list, traces get, and traces export, then read the results:
Real bug — silent failure, not hallucination, in the
support_ticketagent:escalation_summaryhas no retry and just throws. Net effect: the customer gets a polished reply, but the on-call escalation summary silently never gets produced — a P1 escalation drops without anyone knowing.
Here is what the CLI gives your agent, and how it is built:
- Browser login that knows who you are
- Traces, from overview to deep dive:
list,get,export - Output built for a model:
--jsonand exit codes that mean something - One OpenAPI schema behind every command, shared with the agent inside the TraceRoot app
Log in once
npm install -g traceroot-cli
traceroot login                   # approve in the browser
traceroot projects list
export TRACEROOT_PROJECT_ID=<id>
traceroot login opens a browser approval and scopes the CLI to you, not to a project. That was the step everyone tripped on, so projects list is there to discover what your account has, instead of you pasting ids out of the UI.
From overview to deep dive
traceroot traces list --since 3h                       # recent runs
traceroot traces get <trace-id>                        # span tree with time, tokens, cost
traceroot traces get <trace-id> --json --fields full   # plus prompts and completions
traceroot traces export <trace-id>                     # everything, written to a folder
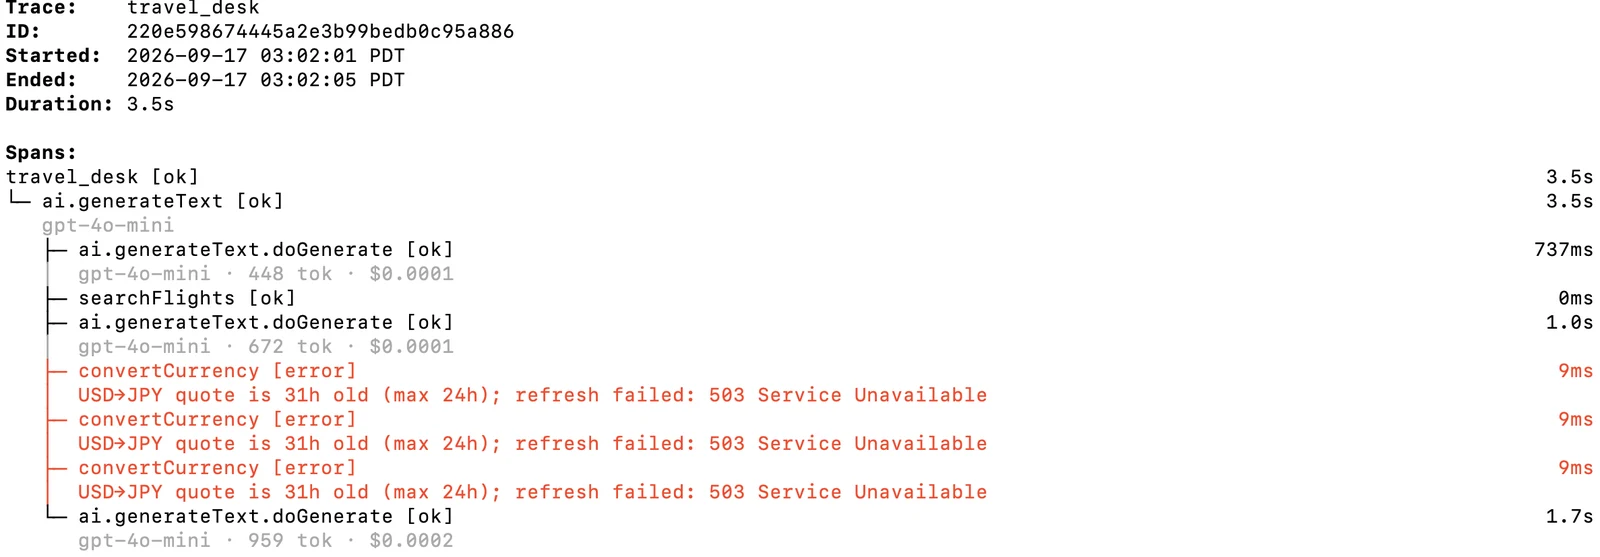
This is the data behind the trace viewer, in the terminal. That matters less for you and more for the agent sitting next to you. Two small touches are for both of you: the trace link at the bottom is clickable in your terminal and a plain URL when piped, and --from accepts a timestamp pasted straight from traces list.
Why is the default view light?
It keeps the output inside a context window when the reader is a model rather than a person. The API splits every span into field groups (core, usage, io, metadata), and the default never runs the query for prompts and completions. We learned to spell that default out the hard way. When our trace page first switched to the light view, export picked it up too and quietly wrote every prompt as null. An agent reading that file concluded the prompts were never captured and stopped looking.
Why export to files?
Some traces run to tens of megabytes, and grep is what coding agents are good at. A coding agent does not need a UI. It needs something it can search. Export writes a folder, nothing is summarized on the way out, and manifest.json lists what is inside so the agent does not have to guess.
$ traceroot traces export <trace-id>
Wrote 4 files: trace.json, spans.json, git_context.json, manifest.json
git_context.json is the file to notice. It records the repo and commit that produced the trace, so the agent reads the code that actually ran, not whatever is on main this afternoon. When the SDK cannot tell, the field stays empty rather than guessing.
Output built for a model
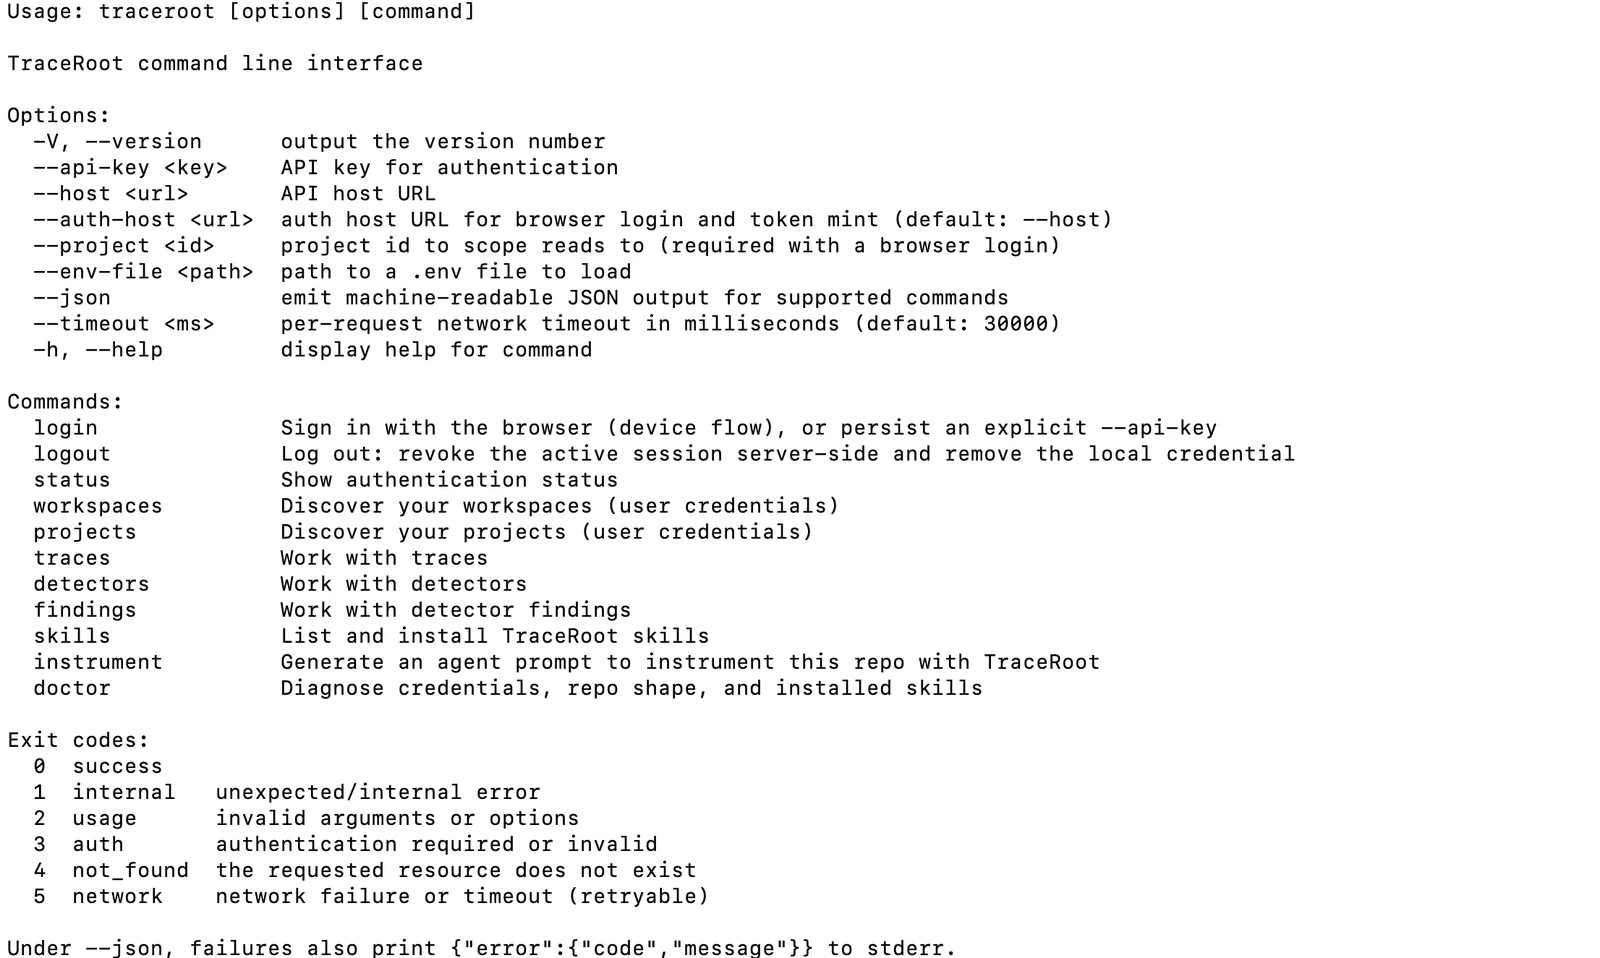
exit codes: 0 success · 1 internal · 2 usage · 3 auth · 4 not_found · 5 network
Every failure has an exit code, and under --json a JSON error on stderr with nothing on stdout, so a pipe never breaks. An agent reads the exit code the way a script does: 2 means fix the input, 5 means try again.
Failures also exit fast. A connection timeout used to hold the process open for about ten seconds after the error printed. It now exits in under one, because an agent waiting on your CLI pays for every second of that wait.
The full surface is small enough to read in one --help:
One OpenAPI schema behind every command
How do the CLI and the agent inside the TraceRoot app stay in sync? Neither one hand-writes its tools. Every operation in our public OpenAPI schema carries an x-tool block with a name and a description written for a model:
"x-tool": {
  "name": "get_trace",
  "description": "Fetch one trace with its span tree. Defaults to the lightweight skeleton projection; pass fields=full for per-span input/output/metadata.",
  "enabled": true
}
From that schema we generate one tool registry. The agent in the app calls it directly, and the CLI places each tool as a command:
// traceroot-cli/src/registry/naming.ts
list_traces:  { kind: "command", path: ["traces", "list"] },
get_trace:    { kind: "command", path: ["traces", "get"] },
export_trace: { kind: "command", path: ["traces", "export"] },
whoami: {
  kind: "internal",
  note: "served by 'status', 'login', and 'doctor'; deliberately no standalone command",
},
Why generate instead of hand-write?
- No drift. The app's agent and the CLI start from the same names and descriptions.
- Every endpoint gets a decision. A new API operation without an
x-toolentry fails the schema build, and a tool with no place in the CLI fails the CLI's tests. "No command" is allowed, but it needs a written reason, likewhoamiabove. - One line per command. Arguments come from the path template and validation comes from the schema, so a new command needs no handler code.
- Descriptions are reviewed where they belong, in the same pull request that changes the endpoint.
So, what will your agent find?
We built the CLI as much for the agent in your terminal as for you. Point it at your recent traffic and see what comes back: the errors, the hallucinations, the runs that were slow and expensive.
npm install -g traceroot-cli
traceroot login
No traces yet? traceroot instrument --agent claude gives your coding agent a prompt to set tracing up.
Then tell us what it found, and anywhere the CLI got in its way. Open an issue on GitHub or find us on Discord.
The trace viewer is for looking. The work happens where the code is. Put the trace there, and let the agent that already lives there read it.