How we trace pi agents, including our own
pi is an open-source agent runtime. Here is how to trace its sessions, turns and tool calls, and how we run our own production agents on pi.
 Xinwei HePublished
 pi runs TraceRoot's in-app agent and its detector investigations. Here is how to trace a pi agent, and what building on pi looks like from the inside.
What pi is
pi is an open-source agent runtime written in TypeScript, started by Mario Zechner. At its center is a loop: the model streams a response, pi runs the tool calls it asked for, appends the results and goes around again until nothing is left to call. Around that loop pi gives you sessions, saved as a tree you can resume or branch from any point, and a provider layer that puts dozens of model vendors behind one interface. Anything beyond that, sub-agents included, comes in as an extension, which keeps the core small enough to read in an afternoon.
You meet pi in one of two ways. The first is as a coding agent: install the pi command, run it in a repository, and it reads files, edits them and runs commands. The second is as a library you embed. @earendil-works/pi-coding-agent gives you that same agent as an AgentSession you drive from your own Node process, and @earendil-works/pi-agent-core gives you the bare Agent class when you want the loop without the coding tools.
The smallest runnable thing is one session and one prompt. It needs Node 22.19 or later, since the package is ESM only:
// 1. One pi session, one prompt
import { createAgentSession, ModelRegistry, ModelRuntime } from '@earendil-works/pi-coding-agent';

const modelRuntime = await ModelRuntime.create();
await modelRuntime.setRuntimeApiKey('openai', process.env.OPENAI_API_KEY);

const modelRegistry = new ModelRegistry(modelRuntime);
const model = modelRegistry.find('openai', 'gpt-4o-mini');

const { session } = await createAgentSession({ model, modelRuntime });
try {
  await session.prompt('Write add.js exporting add(a, b), then write and run a test for it.');
} finally {
  session.dispose();
}
That prompt sends the agent off to write a file, write a test and run it, which is already enough to make you wonder what it did along the way.
Tracing pi
Each of pi's surfaces has its own way in.
For the interactive pi command, install the TraceRoot extension and set two variables before you start pi:
# 2a. The pi CLI
pi install npm:@traceroot-ai/pi-extension
export TRACEROOT_ENABLED=true
export TRACEROOT_API_KEY="tr-..."
For the coding agent as a library, call TraceRoot.initialize() before you create any session. It patches AgentSession, so it has to get there first:
// 2b. pi-coding-agent embedded in your app
import * as pi from '@earendil-works/pi-coding-agent';
import { TraceRoot } from '@traceroot-ai/traceroot';

TraceRoot.initialize({ instrumentModules: { piCodingAgent: pi } });
// createAgentSession() as before
If you build on the Agent class directly, pass pi-agent-core the same way (TypeScript SDK 0.4.0 and later), or call instrumentPiAgentCore(mod, config) yourself when you want to control what gets captured:
// 2c. pi-agent-core's Agent
import * as piAgentCore from '@earendil-works/pi-agent-core';
import { TraceRoot } from '@traceroot-ai/traceroot';

TraceRoot.initialize({ instrumentModules: { piAgentCore } });
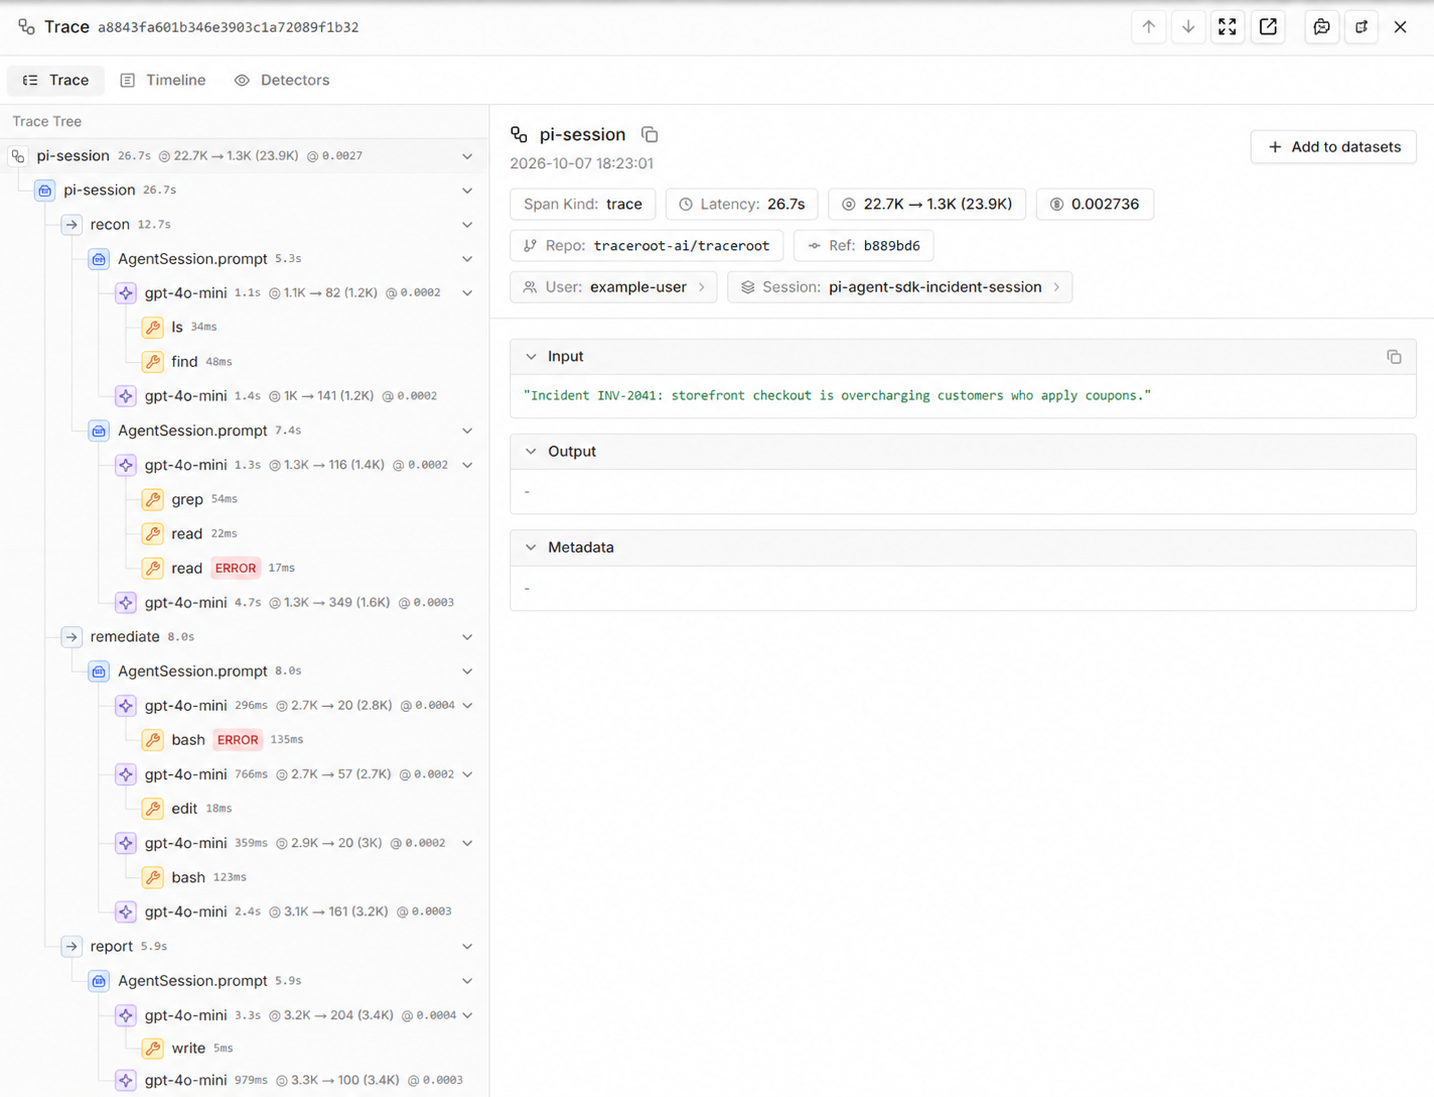
A traced run reads as a tree. In the CLI, each session is a pi.session span and every prompt you send opens a pi.turn beneath it, with model calls and tool calls hanging off the turn. Tool spans are named after what they touched, such as read: pricing.js, so the waterfall makes sense before you expand anything, and compaction gets its own pi.compaction span. When a pi process starts a child pi process as a sub-agent and passes its trace position in PI_ROOT_SPAN_ID and PI_PARENT_SPAN_ID, the child's session nests under the parent instead of starting a fresh trace. In the SDK, every session.prompt() call is an AGENT span with its model and tool spans underneath, and a pi-agent-core trace renders the same way as a pi-coding-agent one. Our example plays out a small checkout incident on one session, and its trace looks like this:
pi-session
├─ recon                      read-only tools
│   ├─ AGENT  map the repo
│   │   └─ TOOL  ls, find
│   └─ AGENT  investigate the overcharge
│       └─ TOOL  grep, read, read (ERROR: config/pricing.json is missing)
├─ remediate                  full tool set
│   └─ AGENT  reproduce, fix, verify
│       └─ TOOL  bash (ERROR: failing test), edit, bash
└─ report
    └─ AGENT  write POSTMORTEM.md
        └─ TOOL  write
This works cleanly because pi publishes its own lifecycle as events. Turns start and end with agent_start and agent_end, model output with message_start and message_end, and tools with tool_execution_start and tool_execution_end. Our extension and SDK listen to that stream instead of wrapping HTTP calls and guessing from the outside where a turn began. When a span opens, it opens on a boundary pi itself declared.
One honest aside about versions. On 0.x packages, a caret range only moves within the minor version, so ^0.80.0 stays on pi 0.80 and ^0.1.8 never reaches 0.4.0. Our own example pins the TraceRoot SDK at ^0.1.8, which means it can't install the release that added instrumentPiAgentCore, and an issue in our repository tracks updating it. The same rule protects you from pi moving underneath you, so pin it deliberately and upgrade on purpose.
We use it ourselves: the in-app agent
The agent inside TraceRoot runs on pi-agent-core's Agent. You can ask it questions about your traces, and it can also change your project: it creates, updates and deletes detectors, dashboards, widgets and alerts.
pi gave us the tool loop, streaming and sessions, which is why a conversation started on the Home page survives you clicking away to another section. What we built on top is the tool layer. Our tools are generated from TraceRoot's public OpenAPI schema into a registry, and the generator fails the build if any write endpoint arrives without policy metadata saying how it gets approved. In the chat, every write pauses for you. Updates show the changed fields as before and after, while deletes need a stated reason from the model and offer only approve or skip. A decision nobody answers is skipped after ten minutes, and in a session nobody is attending, a delete is blocked rather than passed through. Agent writes go into the audit log with the chat session they came from.
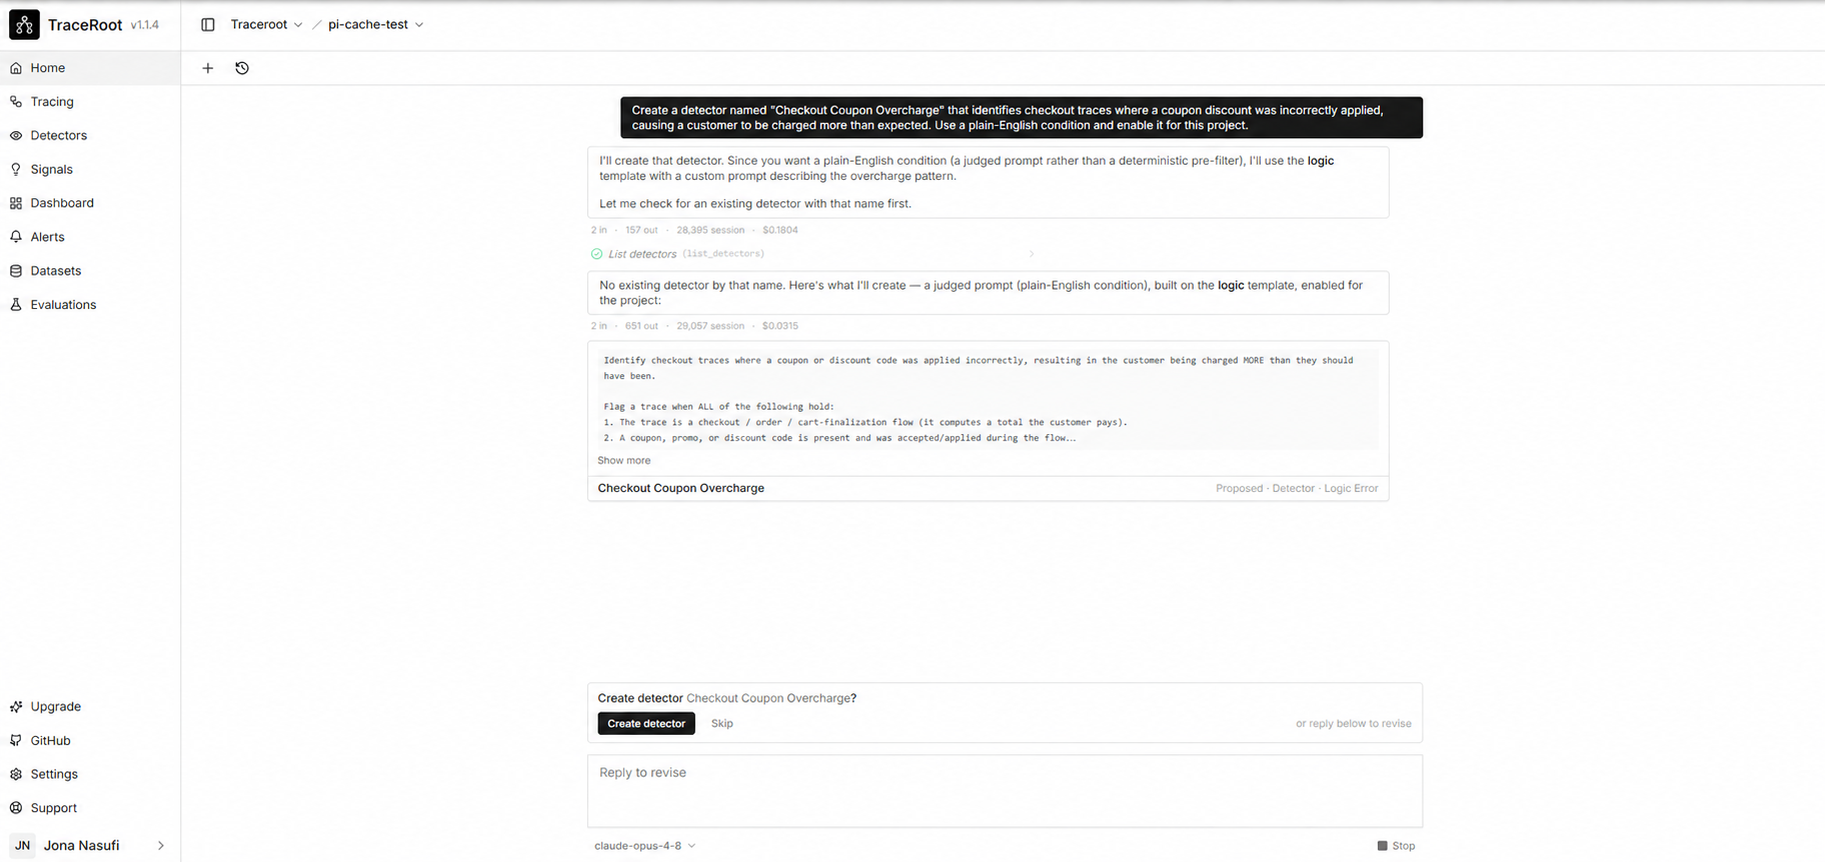
The agent also traces itself through the same instrumentPiAgentCore call you'd use, because we trace our agents the way we ask you to trace yours.
Detectors: pi doing the deep analysis
A detector is a plain-English check that a judge model runs against sampled traces, and when it matches, it produces a finding. If root cause analysis is on, a pi agent picks the trace up. It clones your repository at the relevant commit into an isolated sandbox, reads the exact file and line referenced in the span attributes, and works out from the trace and the code why the run failed, using your GitHub history alongside. With the GitHub integration connected, it can write a fix in the sandbox and open a pull request for you to review, and it never pushes to main. The sandbox can read trace data and retrieve source code, and it cannot reach your production databases, external APIs or infrastructure.
That is the pass most teams do by hand after an alert: open the trace, find the line, run git blame, scroll through last week's PRs.
For a while our own investigations were hard to check. A run of about a dozen tool calls landed in our database as one paragraph, so when a conclusion was wrong, we couldn't see which step had led it there. Because pi marks every model call and tool call as an explicit boundary, the investigation is now a trace in its own right. Findings can share a signal’s analysis. In the example below, the analysis reports that the agent couldn’t find the referenced source file. The investigation trace still shows the tool steps it took, so we can check what happened during the investigation. Those internal traces can't set off detectors or alerts of their own, which matters when the thing being watched is the watcher.
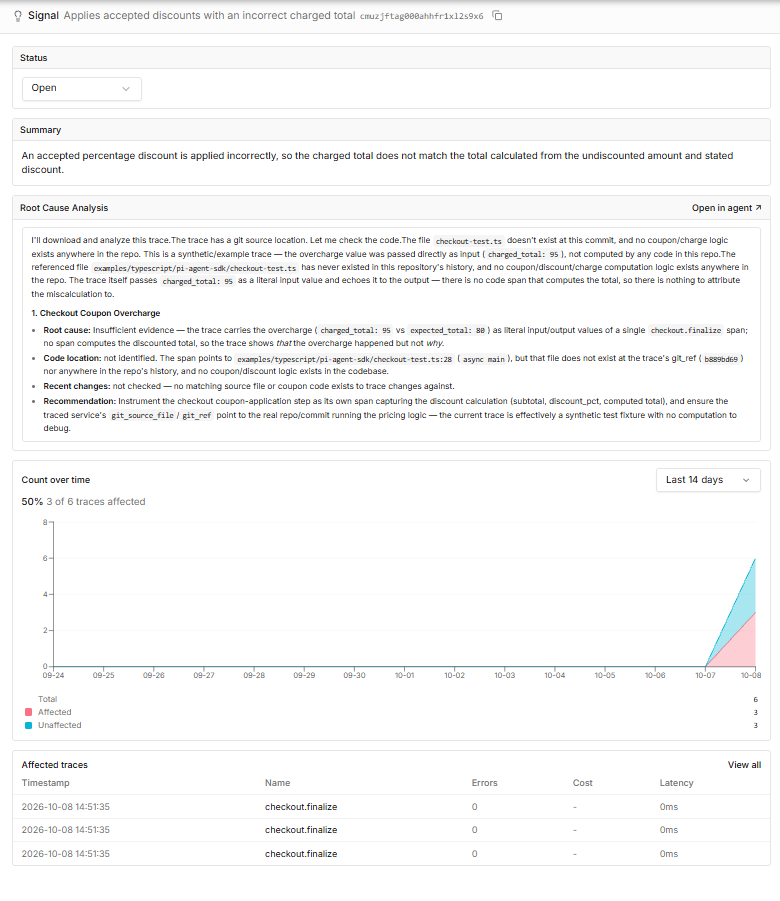
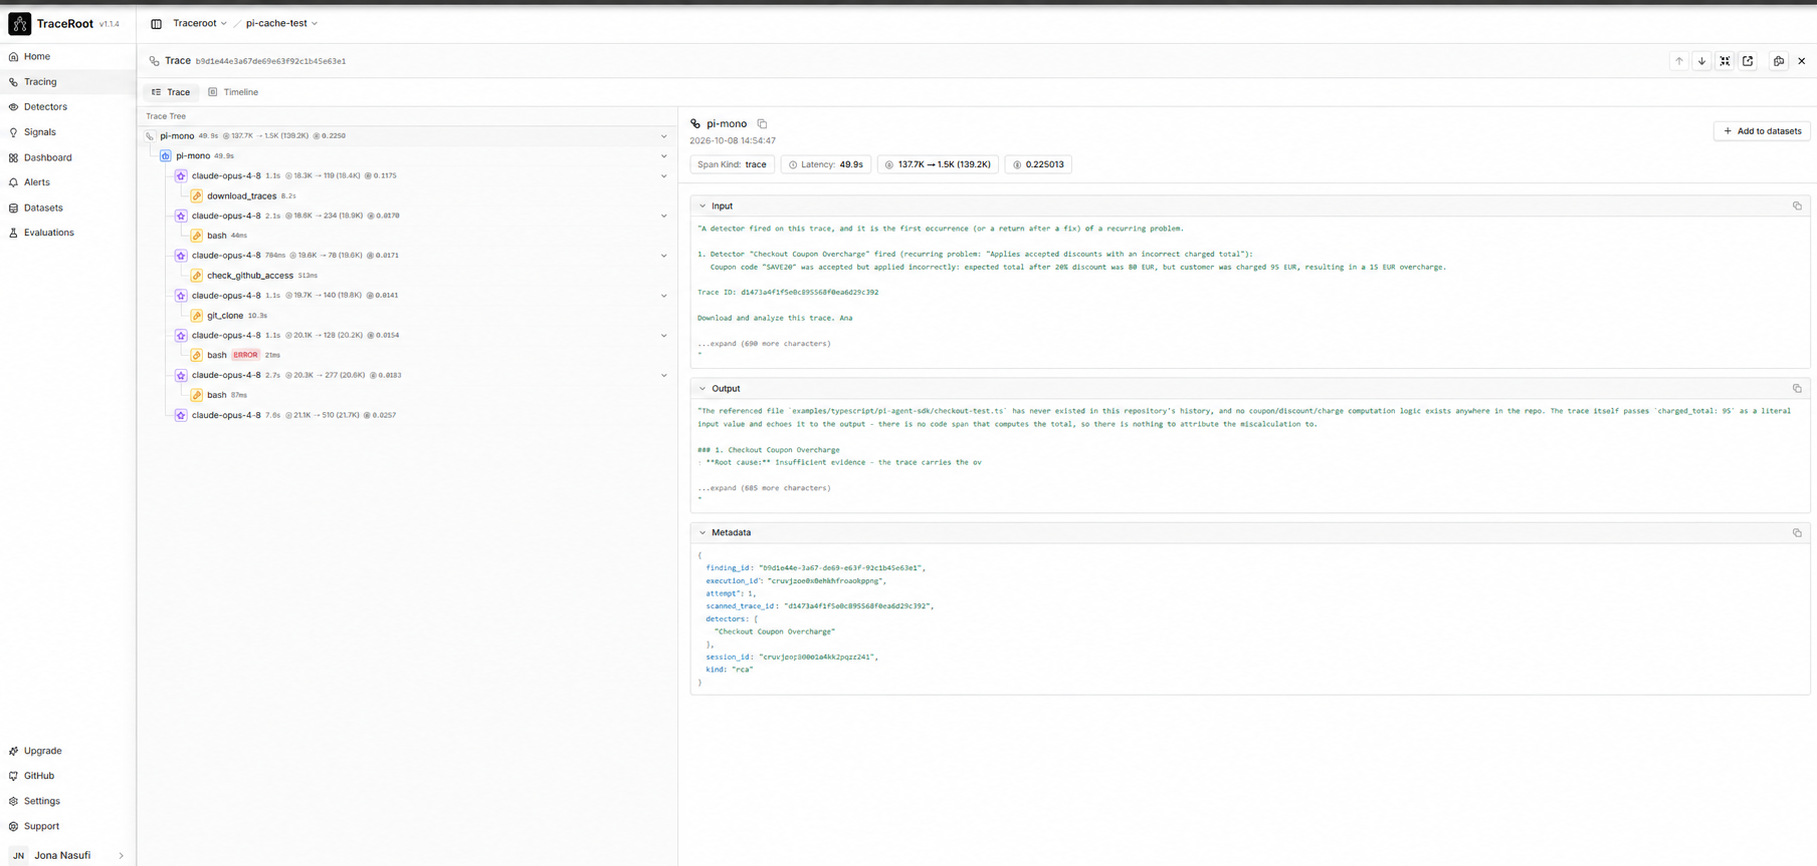
The signal’s analysis reports that the referenced source file couldn’t be found.
If you build on pi, the visibility we rely on for our own agents is one install away, through the extension for the CLI or one line of setup in your app. The example in our repository runs the checkout incident above on a single pi session, narrowing the agent to read-only tools while it investigates and widening them when it fixes. Run it, open the trace, and tell us on GitHub or Discord what you wish pi traces showed that they don't yet. pi already tells you where every boundary is; the work is in reading what happened between them.