> ## Documentation Index
> Fetch the complete documentation index at: https://traceroot.ai/docs/llms.txt
> Use this file to discover all available pages before exploring further.
# Get Started
> Create your first alert and watch it evaluate
This guide walks through creating an alert, checking it against the live preview, and reading its state in the Alerts list.
## Prerequisites
You need:
* A project with incoming traces. See [Tracing](/docs/tracing/get-started) if you don't have that yet.
* A Slack workspace connected to your TraceRoot workspace, with a destination channel selected. Slack is the only place alerts are delivered. See [Slack delivery](/docs/alerts/slack) to connect it.
* Member access to the project. Viewers can see alerts but cannot create or change them.
## Create an alert
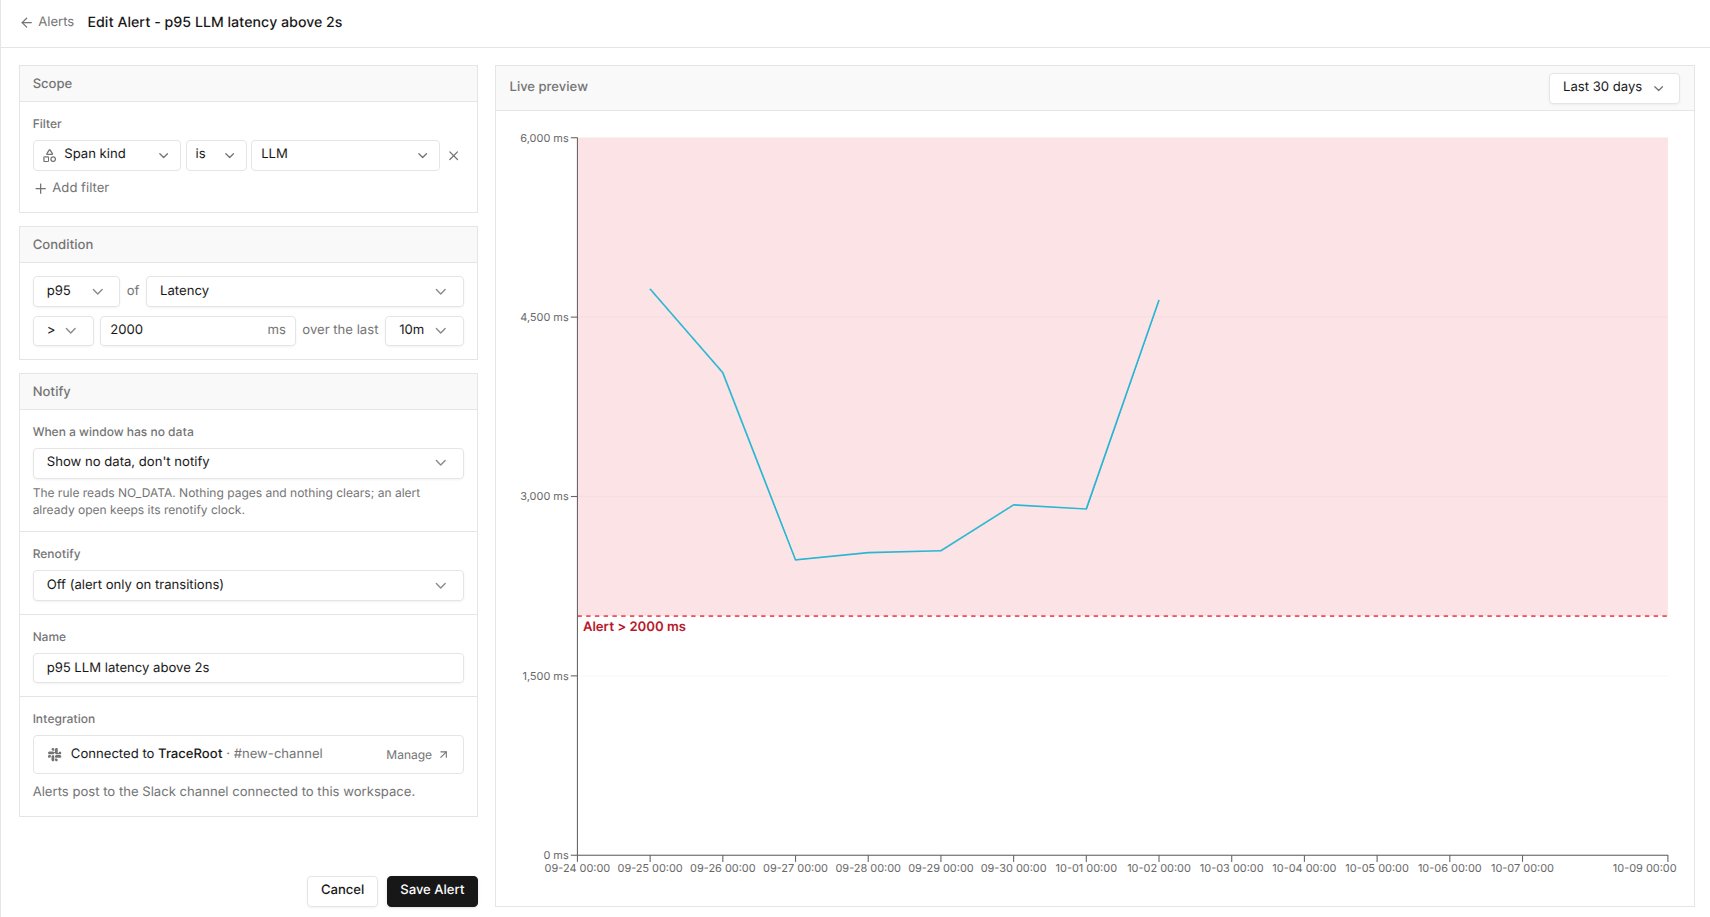
Open your project in [TraceRoot Cloud](https://app.traceroot.ai), select **Alerts** from the left nav, then click **New Alert**. The form has three sections on the left and a **Live preview** on the right.
 ### Set the scope
Under **Scope**, use **Add filter** to limit which spans are measured, for example `Span kind is LLM`. Leave it empty to measure every span in the project. A metadata filter also needs a key. Half-filled filter rows are ignored.
### Set the condition
**Condition** reads as one sentence: *aggregation* **of** *measure*, *operator* *threshold*, **over the last** *window*. For example, `p95` of **Latency** `>` `2000 ms` over the last `10m`.
1. Pick the **aggregation** and the **measure**. The aggregation list only offers what the selected measure supports: for example, **Count** takes only `count`, and **Latency** takes `avg`, `p95` and the other numeric aggregations.
2. Pick the **operator** and enter the **threshold**.
3. Pick the **window**: how far back each evaluation looks. The default is `10m`.
The threshold field shows the measure's unit: `ms` for latency, `$` for cost and `tok/s` for total tokens per second. A rule for "p95 latency over 2 seconds" uses a threshold of `2000`. Token counts have no unit, and neither do the `count` and `uniq` aggregations. See the [rule reference](/docs/alerts/rule-reference#measures) for every unit.
### Choose how it notifies
Under **Notify**:
1. **When a window has no data**: choose what an empty window means. The default, **Show no data, don't notify**, sends nothing.
2. **Renotify**: leave it **Off (alert only on transitions)**, or choose **Re-alert at a regular interval** to repeat the message while the rule stays in breach.
3. **Name**: how the alert identifies itself in Slack.
The **Integration** row shows the Slack workspace and channel the alert will post to.
Click **Create Alert**. New alerts are active immediately, and the first result appears within a minute.
## Check the live preview
The **Live preview** charts the metric as you edit, so you can tune the rule before saving it. Over a short date range each point is one of the rule's windows; over a long range the points are coarser.
* The **threshold line** is drawn across the chart and labelled with the trigger and its unit, for example `Alert > 2000 ms`.
* The **shaded band** marks the side of the line that breaches.
* The date range selector changes how much history the chart shows. It does not change the rule.
If the chart says **No preview available for this metric yet**, the measure, aggregation and filters cannot be combined. Distinct users and distinct sessions cannot be combined with filters.
## Read the Alerts list
Each row shows the rule's latest state:
* **OK**: the latest value is within the threshold.
* **Alert**: the latest value breaches the threshold.
* **No Data**: the latest window had nothing to measure, or the rule has not run yet.
* **Failing**: the last run failed and will retry next minute.
* **Parked**: the rule's saved settings cannot be evaluated, so it has stopped. Edit and save the rule, or resume it, to start it again.
* **Paused**: evaluation and notifications are stopped until you resume the rule.
Click a badge to read why it shows what it does, including the reason a notification could not be delivered.
## Manage alerts
Use the **Actions** menu on a row to pause or resume, edit, or delete a rule.
* **Pause** stops evaluation and notifications. **Resume** starts the rule fresh: its state returns to **No Data** until the next evaluation.
* **Edit** opens the same form. Changing the filters, aggregation, measure, operator, threshold, window or no-data setting also starts the rule fresh. Renaming the rule or changing renotify does not.
* **Delete** removes the rule permanently.
Starting a rule fresh closes any open alert without a recovery message in Slack. If the metric still breaches after an edit or a resume, the next evaluation announces it as a new alert.
A project can hold up to **100 alerts**. Paused alerts count toward the limit.
## Next steps
Every measure, unit, aggregation, filter and state.
What each message contains and how to fix a failed delivery.
This documentation is built and hosted on [Mintlify](https://mintlify.com), a developer documentation platform.
### Set the scope
Under **Scope**, use **Add filter** to limit which spans are measured, for example `Span kind is LLM`. Leave it empty to measure every span in the project. A metadata filter also needs a key. Half-filled filter rows are ignored.
### Set the condition
**Condition** reads as one sentence: *aggregation* **of** *measure*, *operator* *threshold*, **over the last** *window*. For example, `p95` of **Latency** `>` `2000 ms` over the last `10m`.
1. Pick the **aggregation** and the **measure**. The aggregation list only offers what the selected measure supports: for example, **Count** takes only `count`, and **Latency** takes `avg`, `p95` and the other numeric aggregations.
2. Pick the **operator** and enter the **threshold**.
3. Pick the **window**: how far back each evaluation looks. The default is `10m`.
The threshold field shows the measure's unit: `ms` for latency, `$` for cost and `tok/s` for total tokens per second. A rule for "p95 latency over 2 seconds" uses a threshold of `2000`. Token counts have no unit, and neither do the `count` and `uniq` aggregations. See the [rule reference](/docs/alerts/rule-reference#measures) for every unit.
### Choose how it notifies
Under **Notify**:
1. **When a window has no data**: choose what an empty window means. The default, **Show no data, don't notify**, sends nothing.
2. **Renotify**: leave it **Off (alert only on transitions)**, or choose **Re-alert at a regular interval** to repeat the message while the rule stays in breach.
3. **Name**: how the alert identifies itself in Slack.
The **Integration** row shows the Slack workspace and channel the alert will post to.
Click **Create Alert**. New alerts are active immediately, and the first result appears within a minute.
## Check the live preview
The **Live preview** charts the metric as you edit, so you can tune the rule before saving it. Over a short date range each point is one of the rule's windows; over a long range the points are coarser.
* The **threshold line** is drawn across the chart and labelled with the trigger and its unit, for example `Alert > 2000 ms`.
* The **shaded band** marks the side of the line that breaches.
* The date range selector changes how much history the chart shows. It does not change the rule.
If the chart says **No preview available for this metric yet**, the measure, aggregation and filters cannot be combined. Distinct users and distinct sessions cannot be combined with filters.
## Read the Alerts list
Each row shows the rule's latest state:
* **OK**: the latest value is within the threshold.
* **Alert**: the latest value breaches the threshold.
* **No Data**: the latest window had nothing to measure, or the rule has not run yet.
* **Failing**: the last run failed and will retry next minute.
* **Parked**: the rule's saved settings cannot be evaluated, so it has stopped. Edit and save the rule, or resume it, to start it again.
* **Paused**: evaluation and notifications are stopped until you resume the rule.
Click a badge to read why it shows what it does, including the reason a notification could not be delivered.
## Manage alerts
Use the **Actions** menu on a row to pause or resume, edit, or delete a rule.
* **Pause** stops evaluation and notifications. **Resume** starts the rule fresh: its state returns to **No Data** until the next evaluation.
* **Edit** opens the same form. Changing the filters, aggregation, measure, operator, threshold, window or no-data setting also starts the rule fresh. Renaming the rule or changing renotify does not.
* **Delete** removes the rule permanently.
Starting a rule fresh closes any open alert without a recovery message in Slack. If the metric still breaches after an edit or a resume, the next evaluation announces it as a new alert.
A project can hold up to **100 alerts**. Paused alerts count toward the limit.
## Next steps
Every measure, unit, aggregation, filter and state.
What each message contains and how to fix a failed delivery.
This documentation is built and hosted on [Mintlify](https://mintlify.com), a developer documentation platform.