> ## Documentation Index
> Fetch the complete documentation index at: https://traceroot.ai/docs/llms.txt
> Use this file to discover all available pages before exploring further.
# Introduction
> Get notified when your agent gets slow, expensive or fails
Alerts watch your agent's latency, cost, token use and errors, and post to Slack when one crosses a threshold you set. You are notified about a problem when it starts, without having to watch a dashboard.
Alerts are different from [detectors](/docs/detectors/introduction): a detector judges one trace with a prompt; an alert watches a number over time.
Try Alerts and Slack delivery now on any plan, including Free and self-hosted. A project can hold up to 100 alerts.
 ## How alerts work
A rule reads as one sentence: *aggregation* of *measure*, over spans matching the *filters*, in the last *window*, compared to a *threshold*. For example, `p95` of **Latency** over LLM spans in the last `10m`, `>` `2000` ms.
Each evaluation reads **OK**, **Alert** or **No Data**, and only a change notifies:
* Entering **Alert** sends a message, and recovering to **OK** sends another.
* A rule that stays in **Alert** is quiet unless **Renotify** is on.
* To be told when traffic stops, alert on **Count** `<` `1`. Count rules read `0` on an empty window, never **No Data**.
* Other rules read **No Data** on an empty window and stay quiet, by default. **Treat as zero** compares `0` to the threshold instead, and **Notify when data stops** sends a message for the gap.
## How to create an alert
You need incoming traces, the **Member** role or higher, and Slack connected to the workspace (see [Slack notifications](#slack-notifications)).
Open your project in [TraceRoot Cloud](https://app.traceroot.ai), select **Alerts** from the left nav, then click **New Alert**.
1. **Scope**: click **Add filter** to limit which spans are measured, such as `Span kind is LLM`. Leave it empty to measure every span.
2. **Condition**: pick the aggregation and measure, the operator and threshold, and the window. The threshold is in the measure's unit, so "p95 latency over 2 seconds" is `2000`. A rule has one threshold; for a warning and a critical level, create two alerts.
3. **Notify**: set **When a window has no data** and **Renotify**, and enter a **Name**. The defaults notify only on a breach and a recovery. **Integration** shows the Slack channel the alert posts to.
4. Click **Create Alert**. The rule is active immediately, and its first result appears within a minute.
The **Live preview** charts the rule as you edit, with the threshold drawn across it. If it shows **No preview available for this metric yet**, the measure, aggregation and filters cannot be combined, and **Create Alert** stays disabled.
## Create alerts with AI
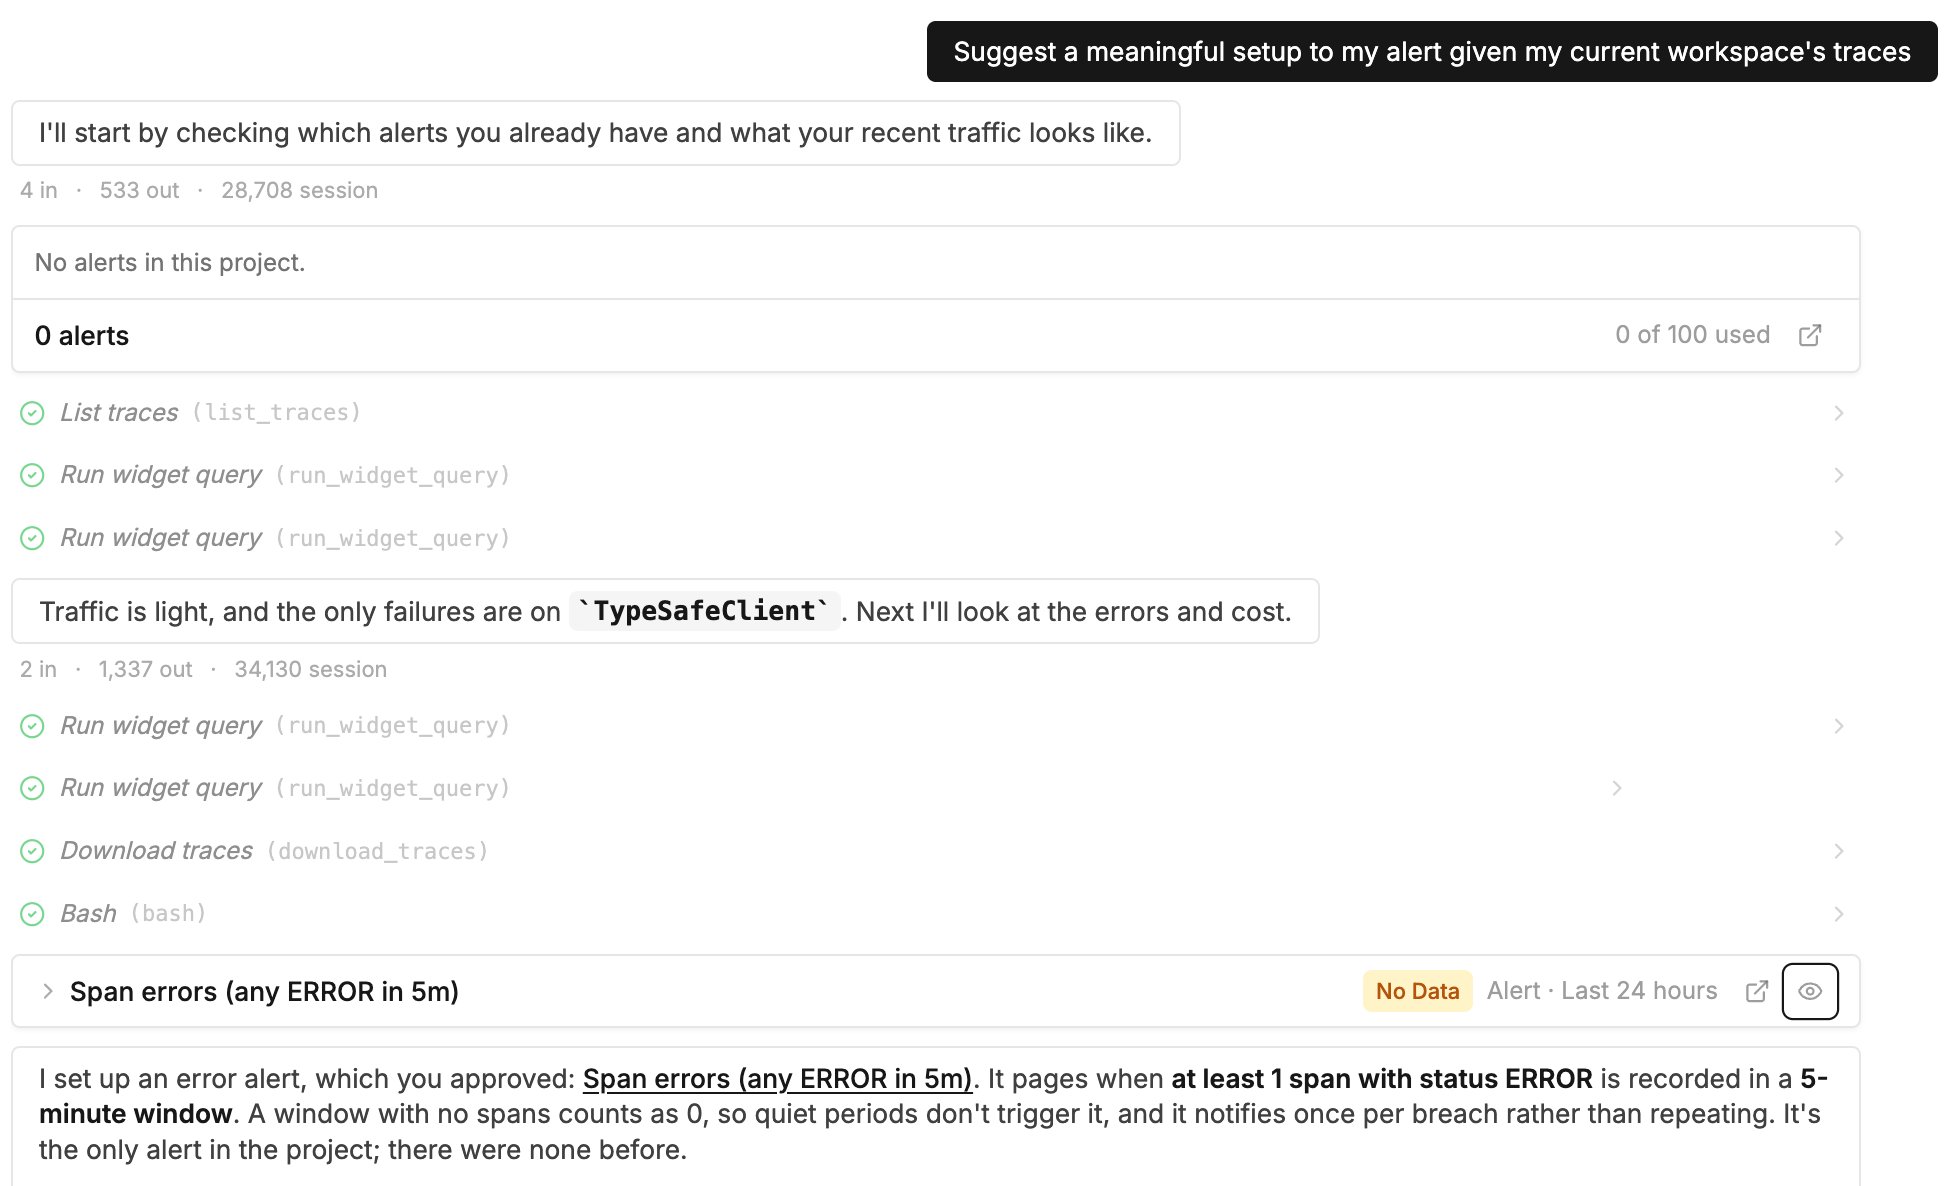
Select **Home** from the left nav to open the AI agent, then describe the alert you want, or ask it to suggest one from your traces. For example:
* "Alert me when p99 latency of LLM spans goes over 2 seconds"
* "Suggest a useful alert for this project based on my recent traces"
The agent drafts the rule with its preview chart. Nothing is saved until you click **Create alert** under the chat; reply instead to revise the draft.
## How alerts work
A rule reads as one sentence: *aggregation* of *measure*, over spans matching the *filters*, in the last *window*, compared to a *threshold*. For example, `p95` of **Latency** over LLM spans in the last `10m`, `>` `2000` ms.
Each evaluation reads **OK**, **Alert** or **No Data**, and only a change notifies:
* Entering **Alert** sends a message, and recovering to **OK** sends another.
* A rule that stays in **Alert** is quiet unless **Renotify** is on.
* To be told when traffic stops, alert on **Count** `<` `1`. Count rules read `0` on an empty window, never **No Data**.
* Other rules read **No Data** on an empty window and stay quiet, by default. **Treat as zero** compares `0` to the threshold instead, and **Notify when data stops** sends a message for the gap.
## How to create an alert
You need incoming traces, the **Member** role or higher, and Slack connected to the workspace (see [Slack notifications](#slack-notifications)).
Open your project in [TraceRoot Cloud](https://app.traceroot.ai), select **Alerts** from the left nav, then click **New Alert**.
1. **Scope**: click **Add filter** to limit which spans are measured, such as `Span kind is LLM`. Leave it empty to measure every span.
2. **Condition**: pick the aggregation and measure, the operator and threshold, and the window. The threshold is in the measure's unit, so "p95 latency over 2 seconds" is `2000`. A rule has one threshold; for a warning and a critical level, create two alerts.
3. **Notify**: set **When a window has no data** and **Renotify**, and enter a **Name**. The defaults notify only on a breach and a recovery. **Integration** shows the Slack channel the alert posts to.
4. Click **Create Alert**. The rule is active immediately, and its first result appears within a minute.
The **Live preview** charts the rule as you edit, with the threshold drawn across it. If it shows **No preview available for this metric yet**, the measure, aggregation and filters cannot be combined, and **Create Alert** stays disabled.
## Create alerts with AI
Select **Home** from the left nav to open the AI agent, then describe the alert you want, or ask it to suggest one from your traces. For example:
* "Alert me when p99 latency of LLM spans goes over 2 seconds"
* "Suggest a useful alert for this project based on my recent traces"
The agent drafts the rule with its preview chart. Nothing is saved until you click **Create alert** under the chat; reply instead to revise the draft.
 AI coding agents can also create alerts with the [TraceRoot CLI](/docs/cli/get-started) (`traceroot alerts create`) or the public API under `/api/v1/public/alerts`. Writes need a signed-in user; a project API key can only read.
## Alert states
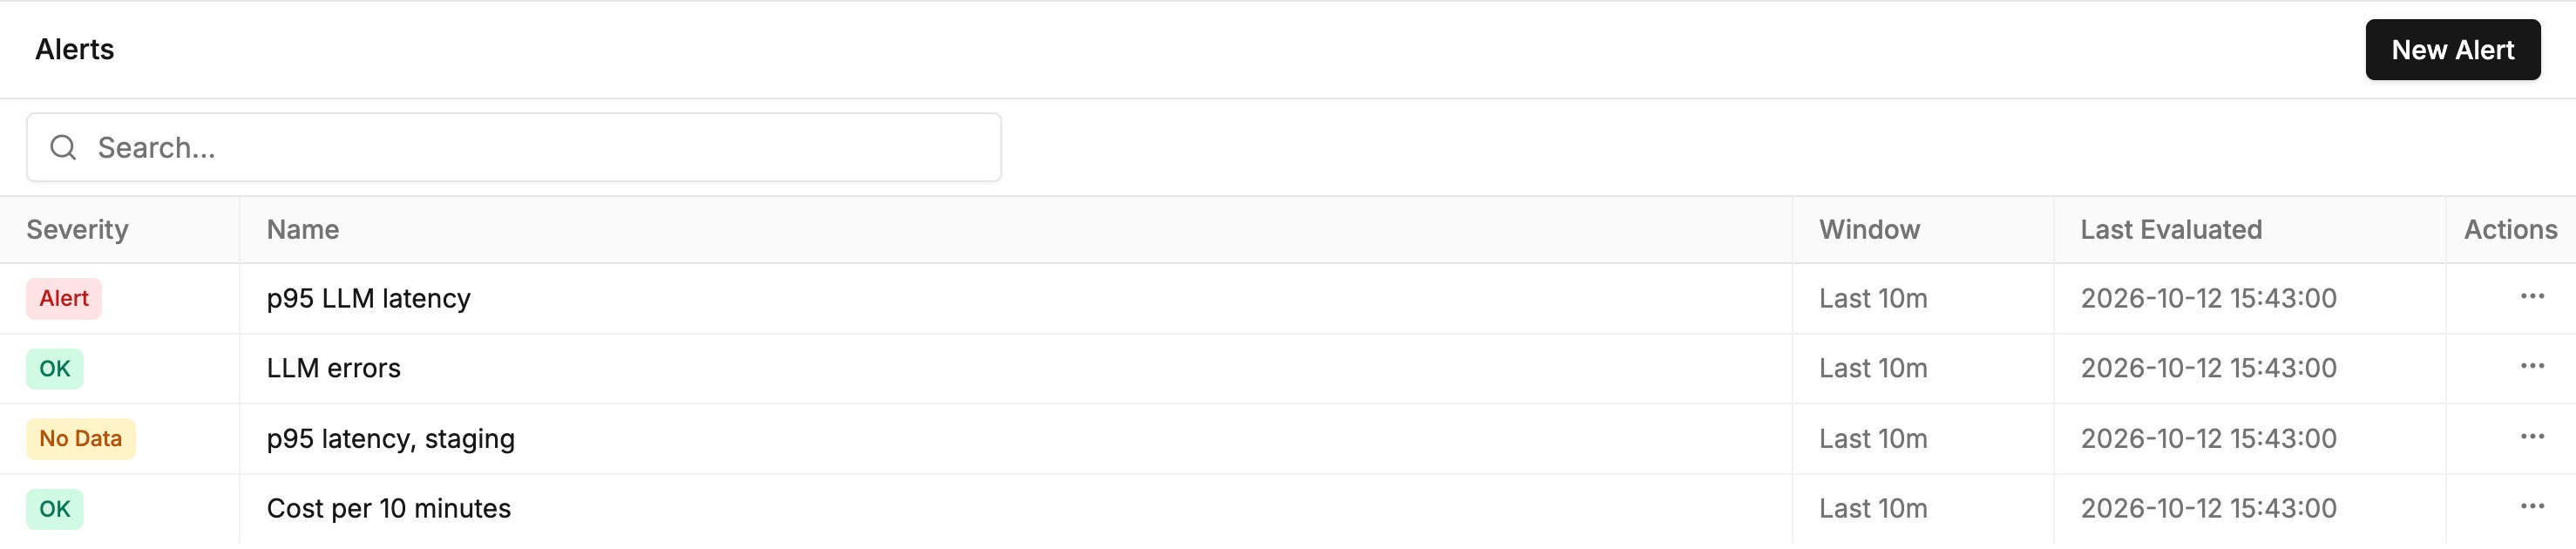
Each row in the Alerts list shows a badge. When a badge has a reason, such as why a notification was not delivered, click it to read it.
* **OK**: the latest value is within the threshold.
* **Alert**: the latest value breaches the threshold.
* **No Data**: the latest window was empty, or the rule has not run yet.
* **Failing**: the last run failed. It retries on its normal schedule.
* **Parked**: TraceRoot stopped the rule because its settings cannot be evaluated. Fix the setting the badge names and save, or resume the rule.
* **Paused**: you stopped the rule. Nothing is evaluated or sent.
## Manage alerts
Use the **Actions** menu on a row:
* **Pause** stops evaluation and notifications. **Resume** starts the rule fresh.
* **Edit** opens the same form. Saving a change to the rule starts it fresh; a rename or a renotify change does not.
* **Delete** removes the rule permanently. Type the alert's name to confirm.
Starting fresh closes an open alert without a recovery message; see [Starting fresh](/docs/alerts/rule-reference#starting-fresh).
## Slack notifications
Slack is connected once per TraceRoot workspace, and every project in it posts alerts to that channel. Detector notifications use the same connection.
1. As a workspace admin, open **Settings → Integrations**.
2. Click **Connect** and complete the authorization in Slack.
3. Pick the channel TraceRoot should post to.
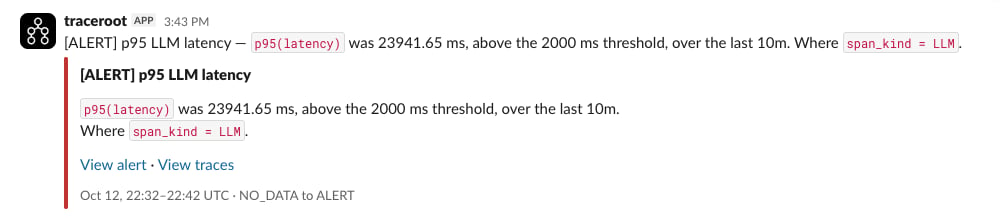
Each message names the state and the rule, such as `[ALERT] p95 latency`, then states the value, threshold, window and filters in one sentence. **View alert** opens the rule, and a breach also links **View traces** for the evaluated window.
AI coding agents can also create alerts with the [TraceRoot CLI](/docs/cli/get-started) (`traceroot alerts create`) or the public API under `/api/v1/public/alerts`. Writes need a signed-in user; a project API key can only read.
## Alert states
Each row in the Alerts list shows a badge. When a badge has a reason, such as why a notification was not delivered, click it to read it.
* **OK**: the latest value is within the threshold.
* **Alert**: the latest value breaches the threshold.
* **No Data**: the latest window was empty, or the rule has not run yet.
* **Failing**: the last run failed. It retries on its normal schedule.
* **Parked**: TraceRoot stopped the rule because its settings cannot be evaluated. Fix the setting the badge names and save, or resume the rule.
* **Paused**: you stopped the rule. Nothing is evaluated or sent.
## Manage alerts
Use the **Actions** menu on a row:
* **Pause** stops evaluation and notifications. **Resume** starts the rule fresh.
* **Edit** opens the same form. Saving a change to the rule starts it fresh; a rename or a renotify change does not.
* **Delete** removes the rule permanently. Type the alert's name to confirm.
Starting fresh closes an open alert without a recovery message; see [Starting fresh](/docs/alerts/rule-reference#starting-fresh).
## Slack notifications
Slack is connected once per TraceRoot workspace, and every project in it posts alerts to that channel. Detector notifications use the same connection.
1. As a workspace admin, open **Settings → Integrations**.
2. Click **Connect** and complete the authorization in Slack.
3. Pick the channel TraceRoot should post to.
Each message names the state and the rule, such as `[ALERT] p95 latency`, then states the value, threshold, window and filters in one sentence. **View alert** opens the rule, and a breach also links **View traces** for the evaluated window.
 ## Next steps
Every measure, unit, aggregation, filter and state.
Email and Slack digests for new and reopened detector signals.
This documentation is built and hosted on [Mintlify](https://mintlify.com), a developer documentation platform.
## Next steps
Every measure, unit, aggregation, filter and state.
Email and Slack digests for new and reopened detector signals.
This documentation is built and hosted on [Mintlify](https://mintlify.com), a developer documentation platform.