> ## Documentation Index
> Fetch the complete documentation index at: https://traceroot.ai/docs/llms.txt
> Use this file to discover all available pages before exploring further.
# Get Started
> Create your first detector and see findings appear
Detectors evaluate your traces and surface problems the moment they happen. This guide walks through creating your first detector, watching the LLM-as-a-judge flag a problem, and reading the AI agent's root cause analysis.
## Prerequisites
You need a project with at least one incoming trace. See [Tracing](/docs/tracing/get-started) if you don't have that yet.
## Create a detector
Open your project in [TraceRoot Cloud](https://app.traceroot.ai), select **Detectors** from the left nav, then click **+ New Detector**.
### Pick a starting point
The create sheet offers a handful of templates covering common failure modes — things like tool errors, hallucinations, logic mistakes, incomplete tasks, and safety issues — plus a blank slate if none of them fit. Pick whichever maps to a problem you've seen in production. The template fills in a prompt you can edit; save, and the detector starts running on the next incoming trace.
### Choose whether to run root cause analysis
The create sheet — and the edit panel for an existing detector — includes a **Run root cause analysis on findings** toggle, on by default. Leave it on and the AI agent investigates each finding; turn it off for a noisy or low-stakes detector where you want findings recorded without paying agent-model cost on every one. Detection is unaffected either way: the detector still fires and records findings.
RCA is shared per trace, so a finding from an RCA-off detector can still be analyzed when an RCA-on detector fires on the same trace. See [Root cause analysis](/docs/detectors/introduction#root-cause-analysis) for the exact rule.
## How it works
The pipeline that runs on every trace:
1. **Ingest.** A trace lands in the project.
2. **Match.** TraceRoot decides which detectors apply (default: all enabled detectors in the project).
3. **Evaluate.** The LLM-as-a-judge (Claude Haiku by default) reads the trace and returns `identified` plus a short summary.
4. **Diagnose.** When `identified` is true, the trace becomes a **finding** and — provided at least one detector that fired on the trace has **Run root cause analysis on findings** enabled — the TraceRoot AI agent investigates: it downloads the trace, reads your production source code at the failure point, checks recent commits and PRs touching that file, and produces a root cause analysis.
5. **Alert.** The combined finding plus RCA is sent to your configured channels (email, Slack).
## View findings
Open the detector to see its findings table. Each row links back to the trace that produced it; clicking the trace opens the trace viewer with a red **Alert** badge in the header.
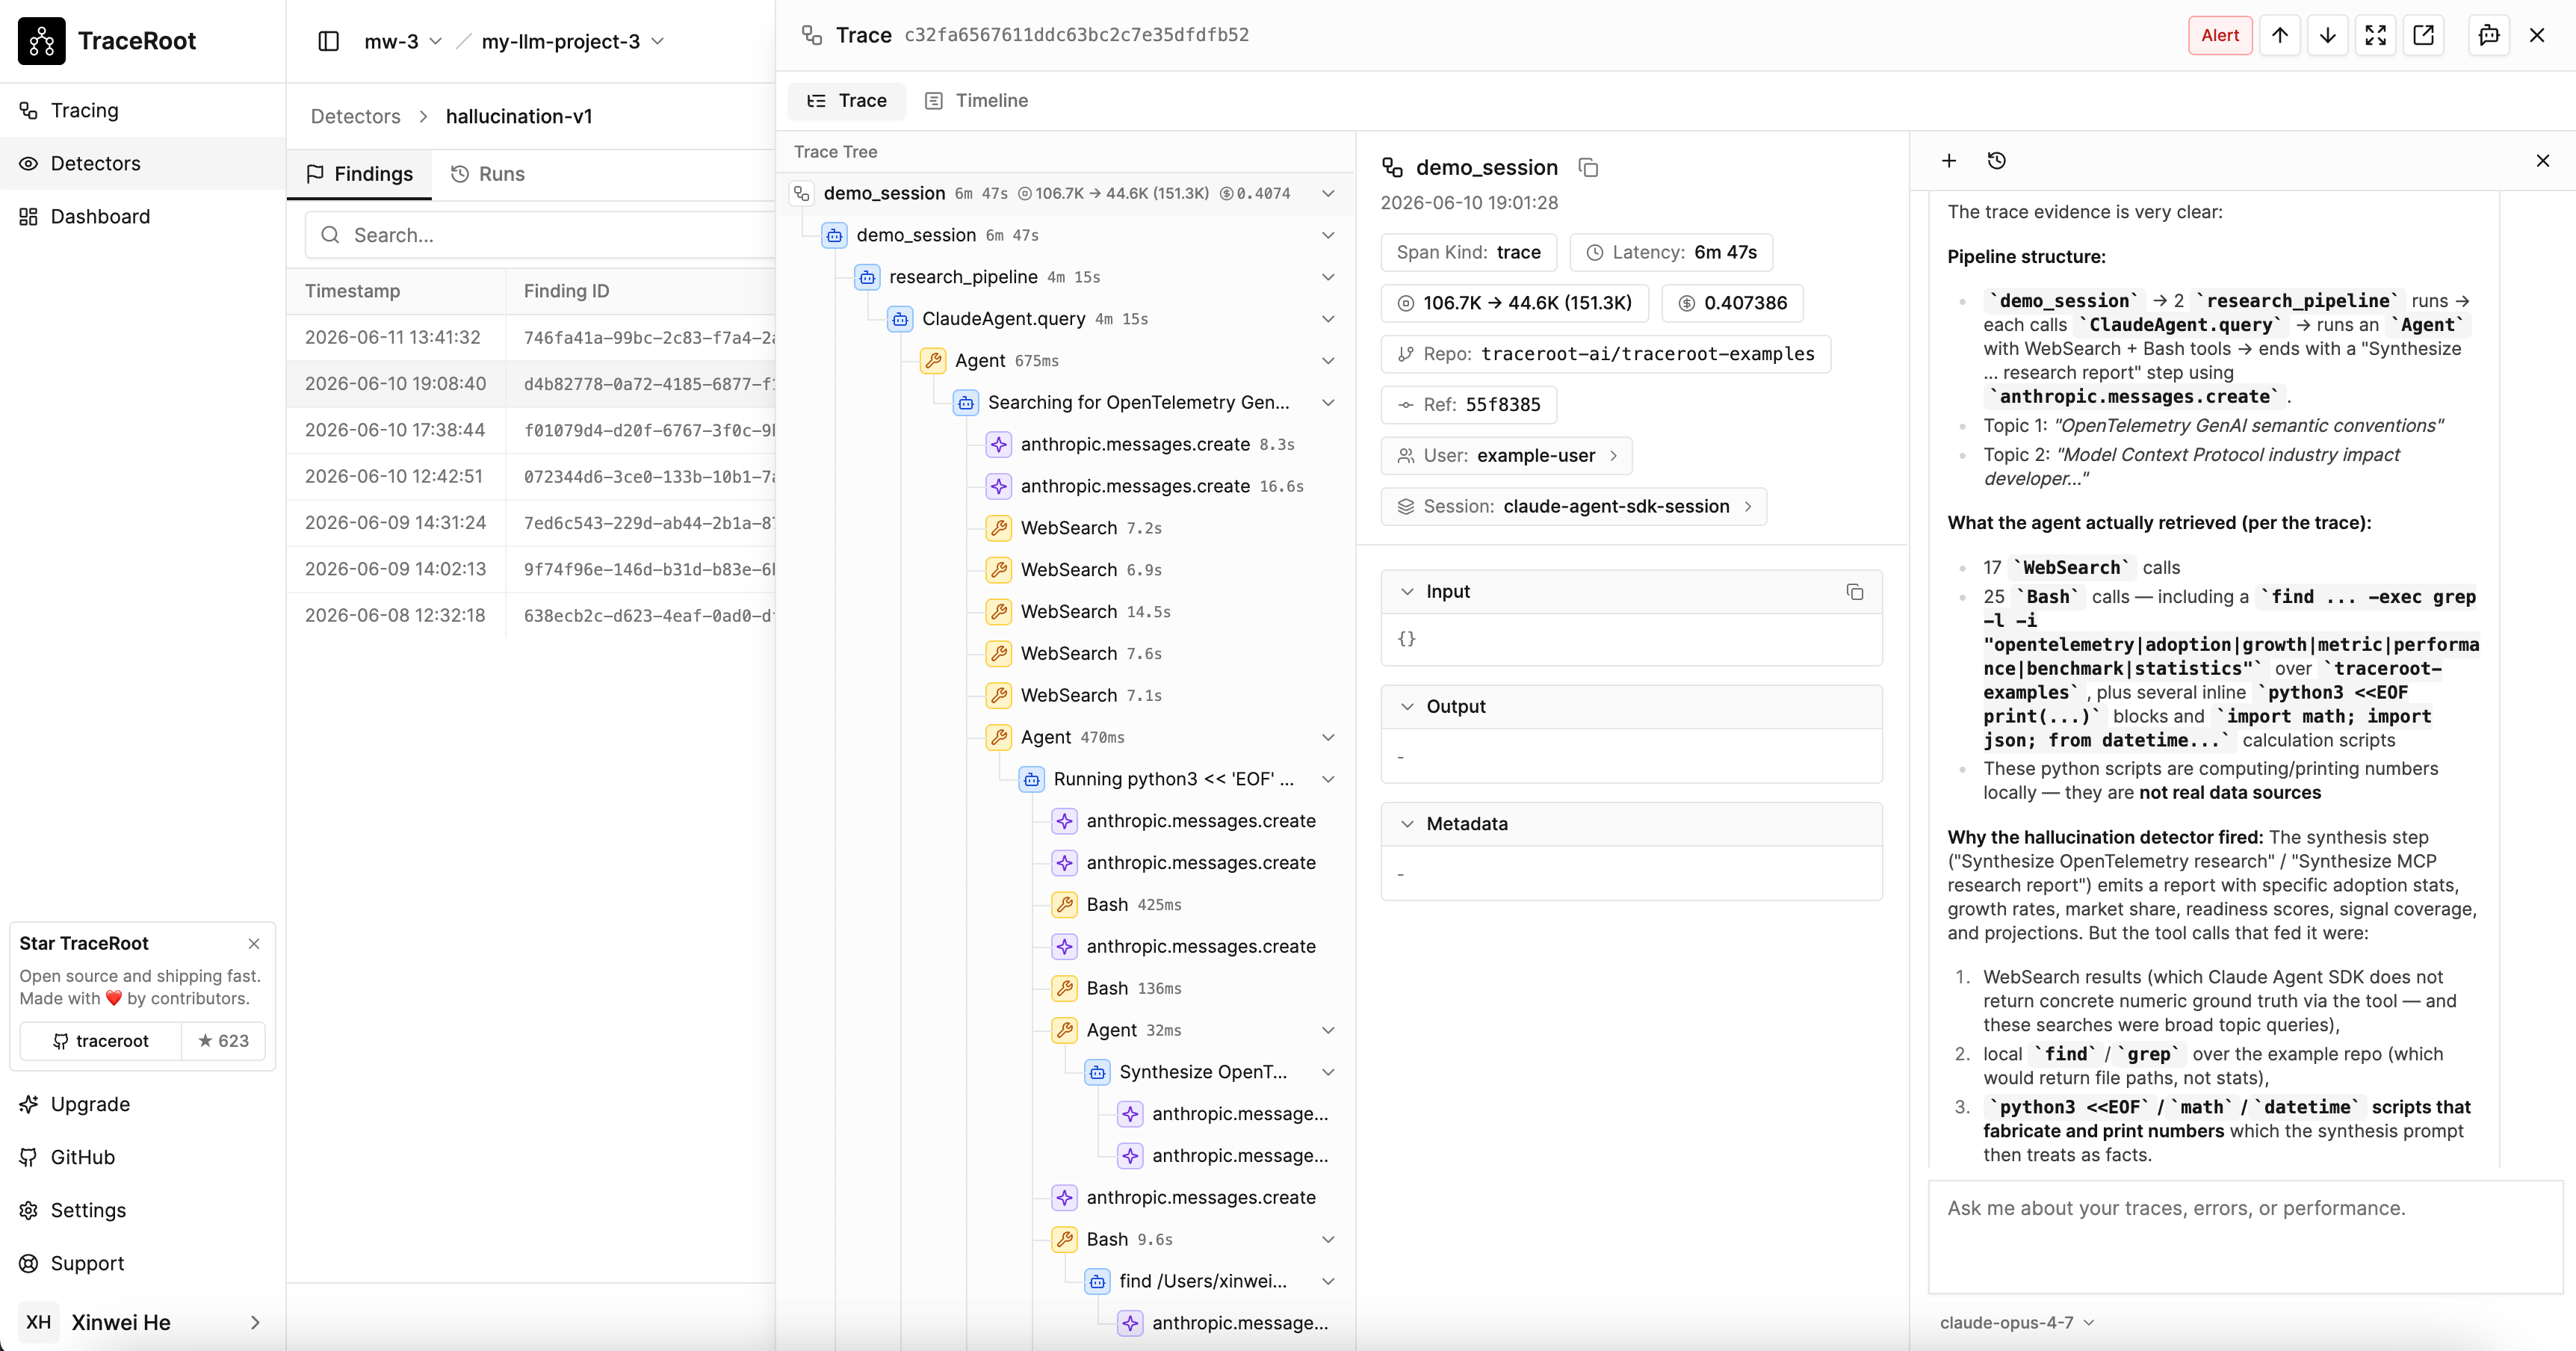 The Alert badge in the trace viewer opens a chat panel pre-loaded with the AI agent's RCA session. From there you can ask follow-up questions in the same session — you're talking to the same agent that wrote the analysis.
## Bring Your Own Key (BYOK)
Both stages of the pipeline — the LLM-as-a-judge and the AI agent — run on a model you choose. Either can use a TraceRoot-provided system model or your own API key, configured independently per stage.
## Next steps
Wire findings to email or Slack.
Learn how the RCA agent behind every finding works.
The Alert badge in the trace viewer opens a chat panel pre-loaded with the AI agent's RCA session. From there you can ask follow-up questions in the same session — you're talking to the same agent that wrote the analysis.
## Bring Your Own Key (BYOK)
Both stages of the pipeline — the LLM-as-a-judge and the AI agent — run on a model you choose. Either can use a TraceRoot-provided system model or your own API key, configured independently per stage.
## Next steps
Wire findings to email or Slack.
Learn how the RCA agent behind every finding works.