> ## Documentation Index
> Fetch the complete documentation index at: https://traceroot.ai/docs/llms.txt
> Use this file to discover all available pages before exploring further.
# Introduction
> Understand what TraceRoot traces and why it matters
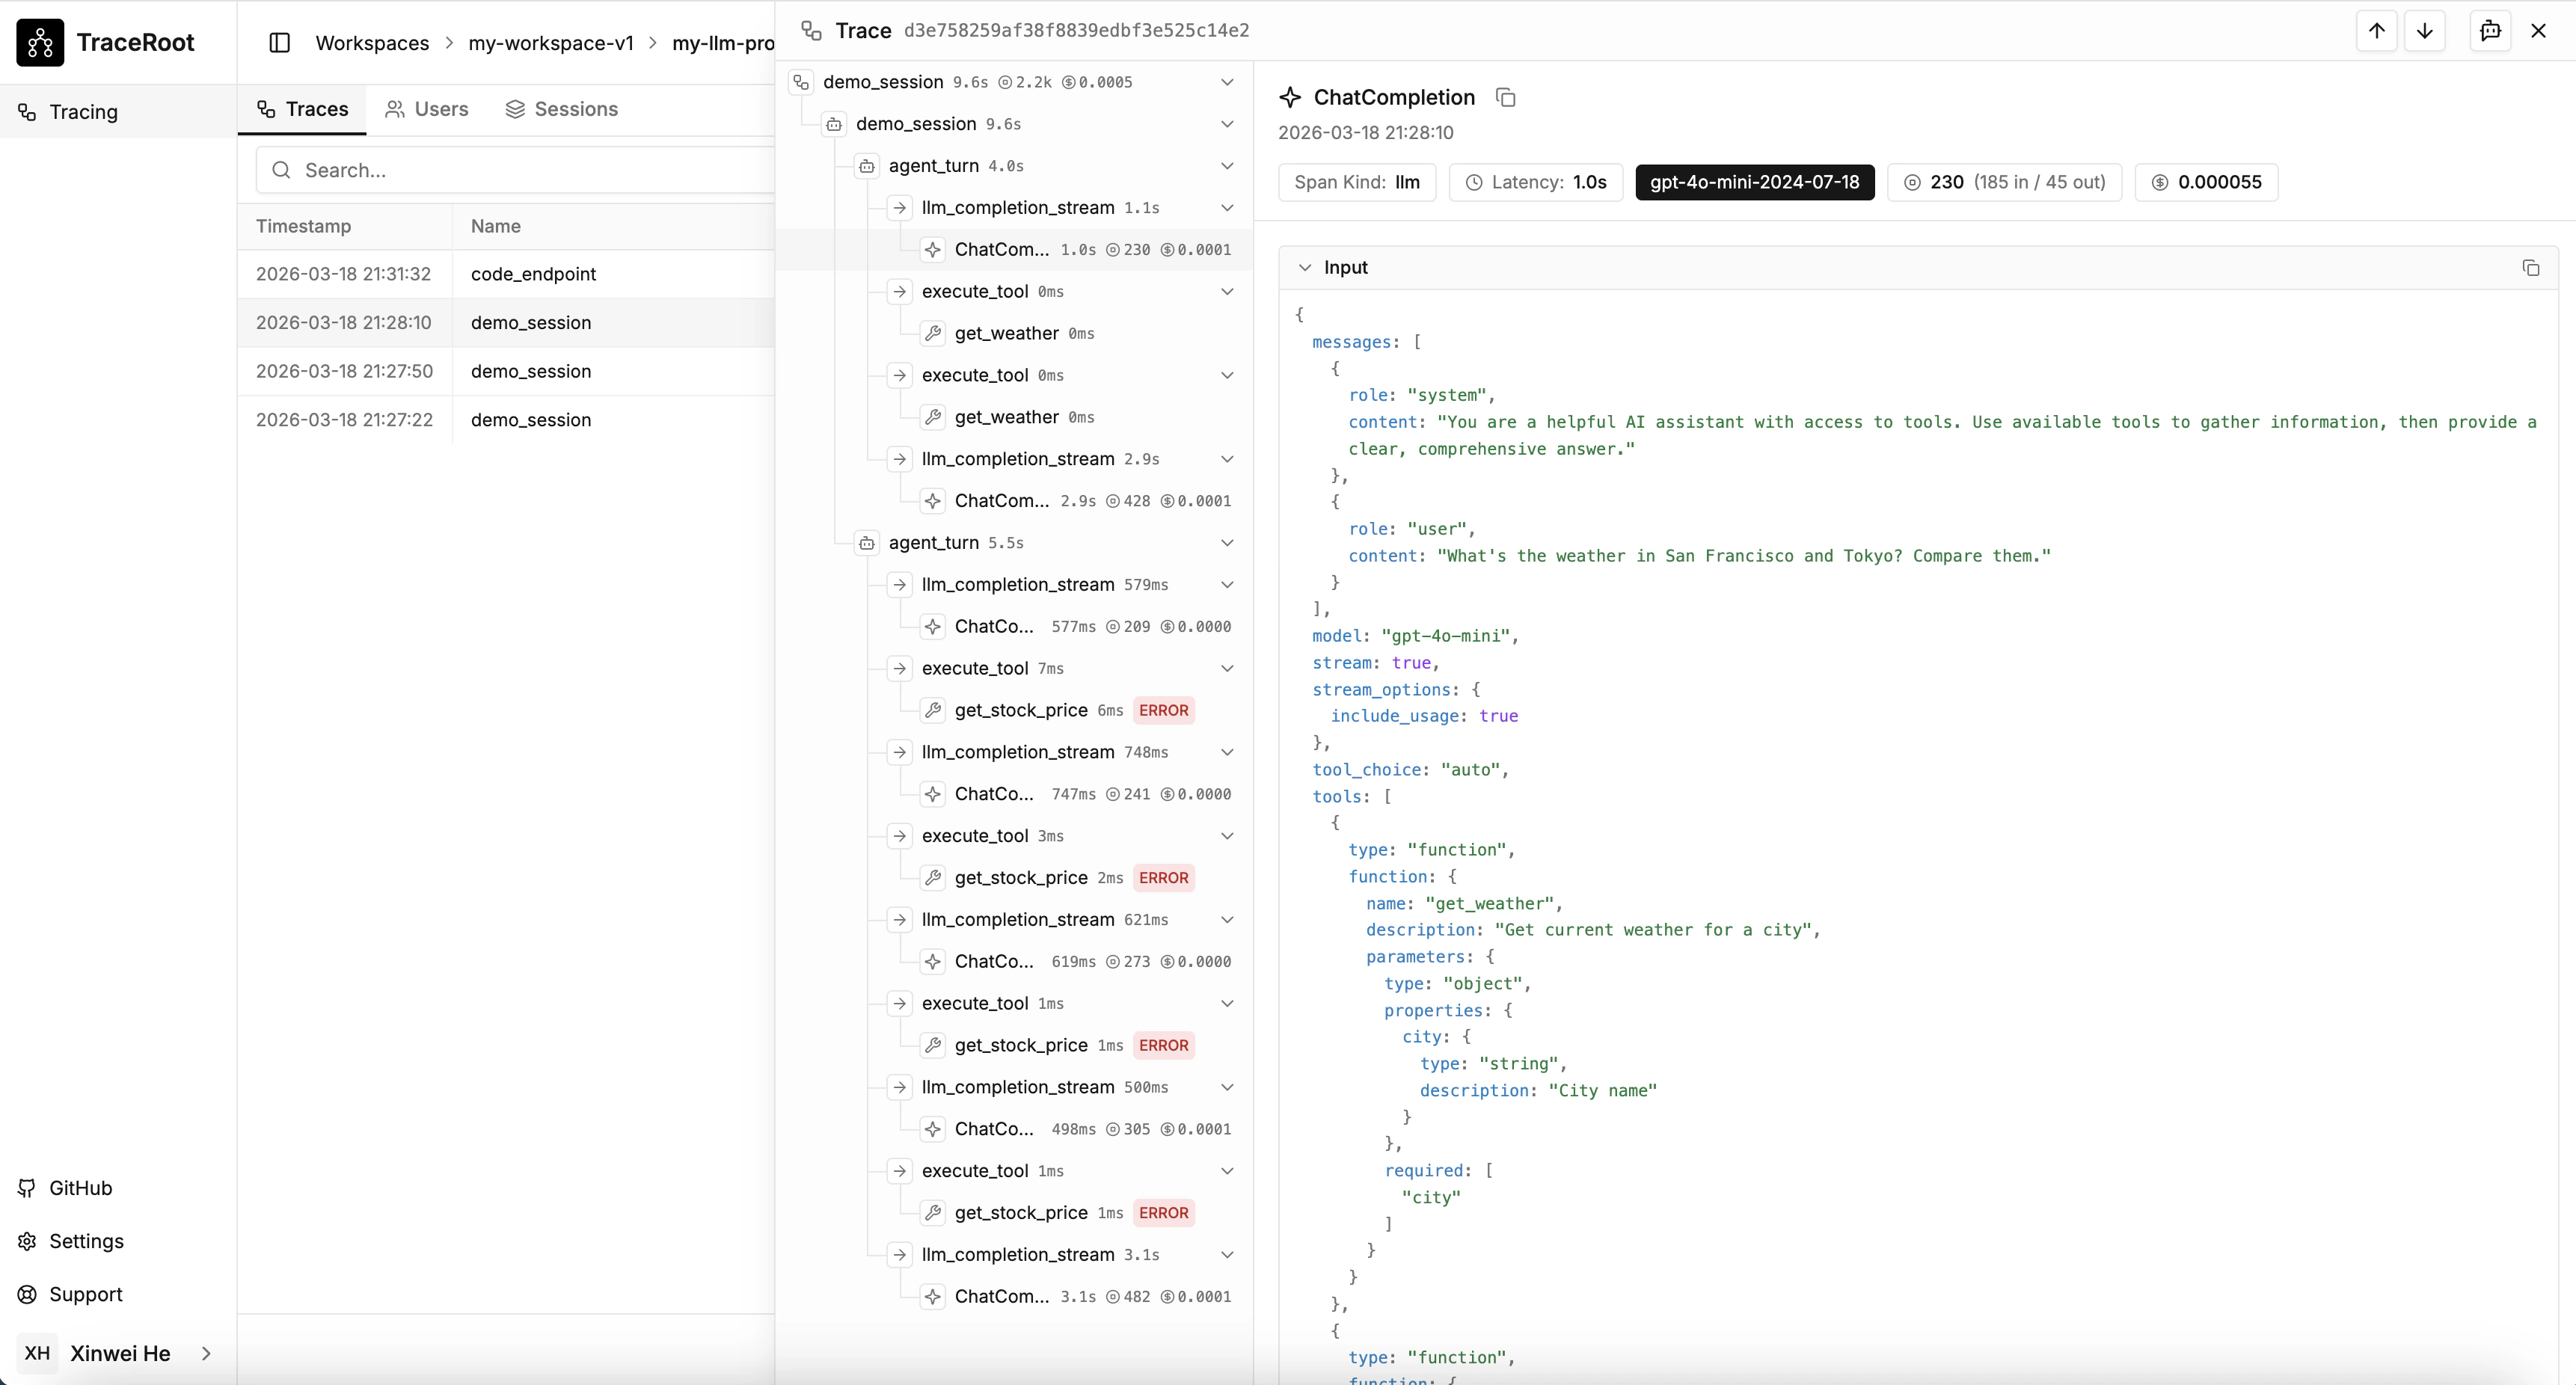
Tracing records what your AI agent does — every LLM call, tool invocation, and function execution — so you can debug individual runs and understand behavior over time.
Once tracing is active, TraceRoot gives you:
* **Full span hierarchy** — see exactly how your agent executes, call by call
* **Token usage and cost** — per LLM call and aggregated per trace
* **Source code correlation** — every span links back to the file and line that produced it
 ## Where to start
Instrument your agent and send your first trace in minutes.
Attach users, sessions, tags, metadata, and more to your traces.
## Where to start
Instrument your agent and send your first trace in minutes.
Attach users, sessions, tags, metadata, and more to your traces.