> ## Documentation Index
> Fetch the complete documentation index at: https://traceroot.ai/docs/llms.txt
> Use this file to discover all available pages before exploring further.
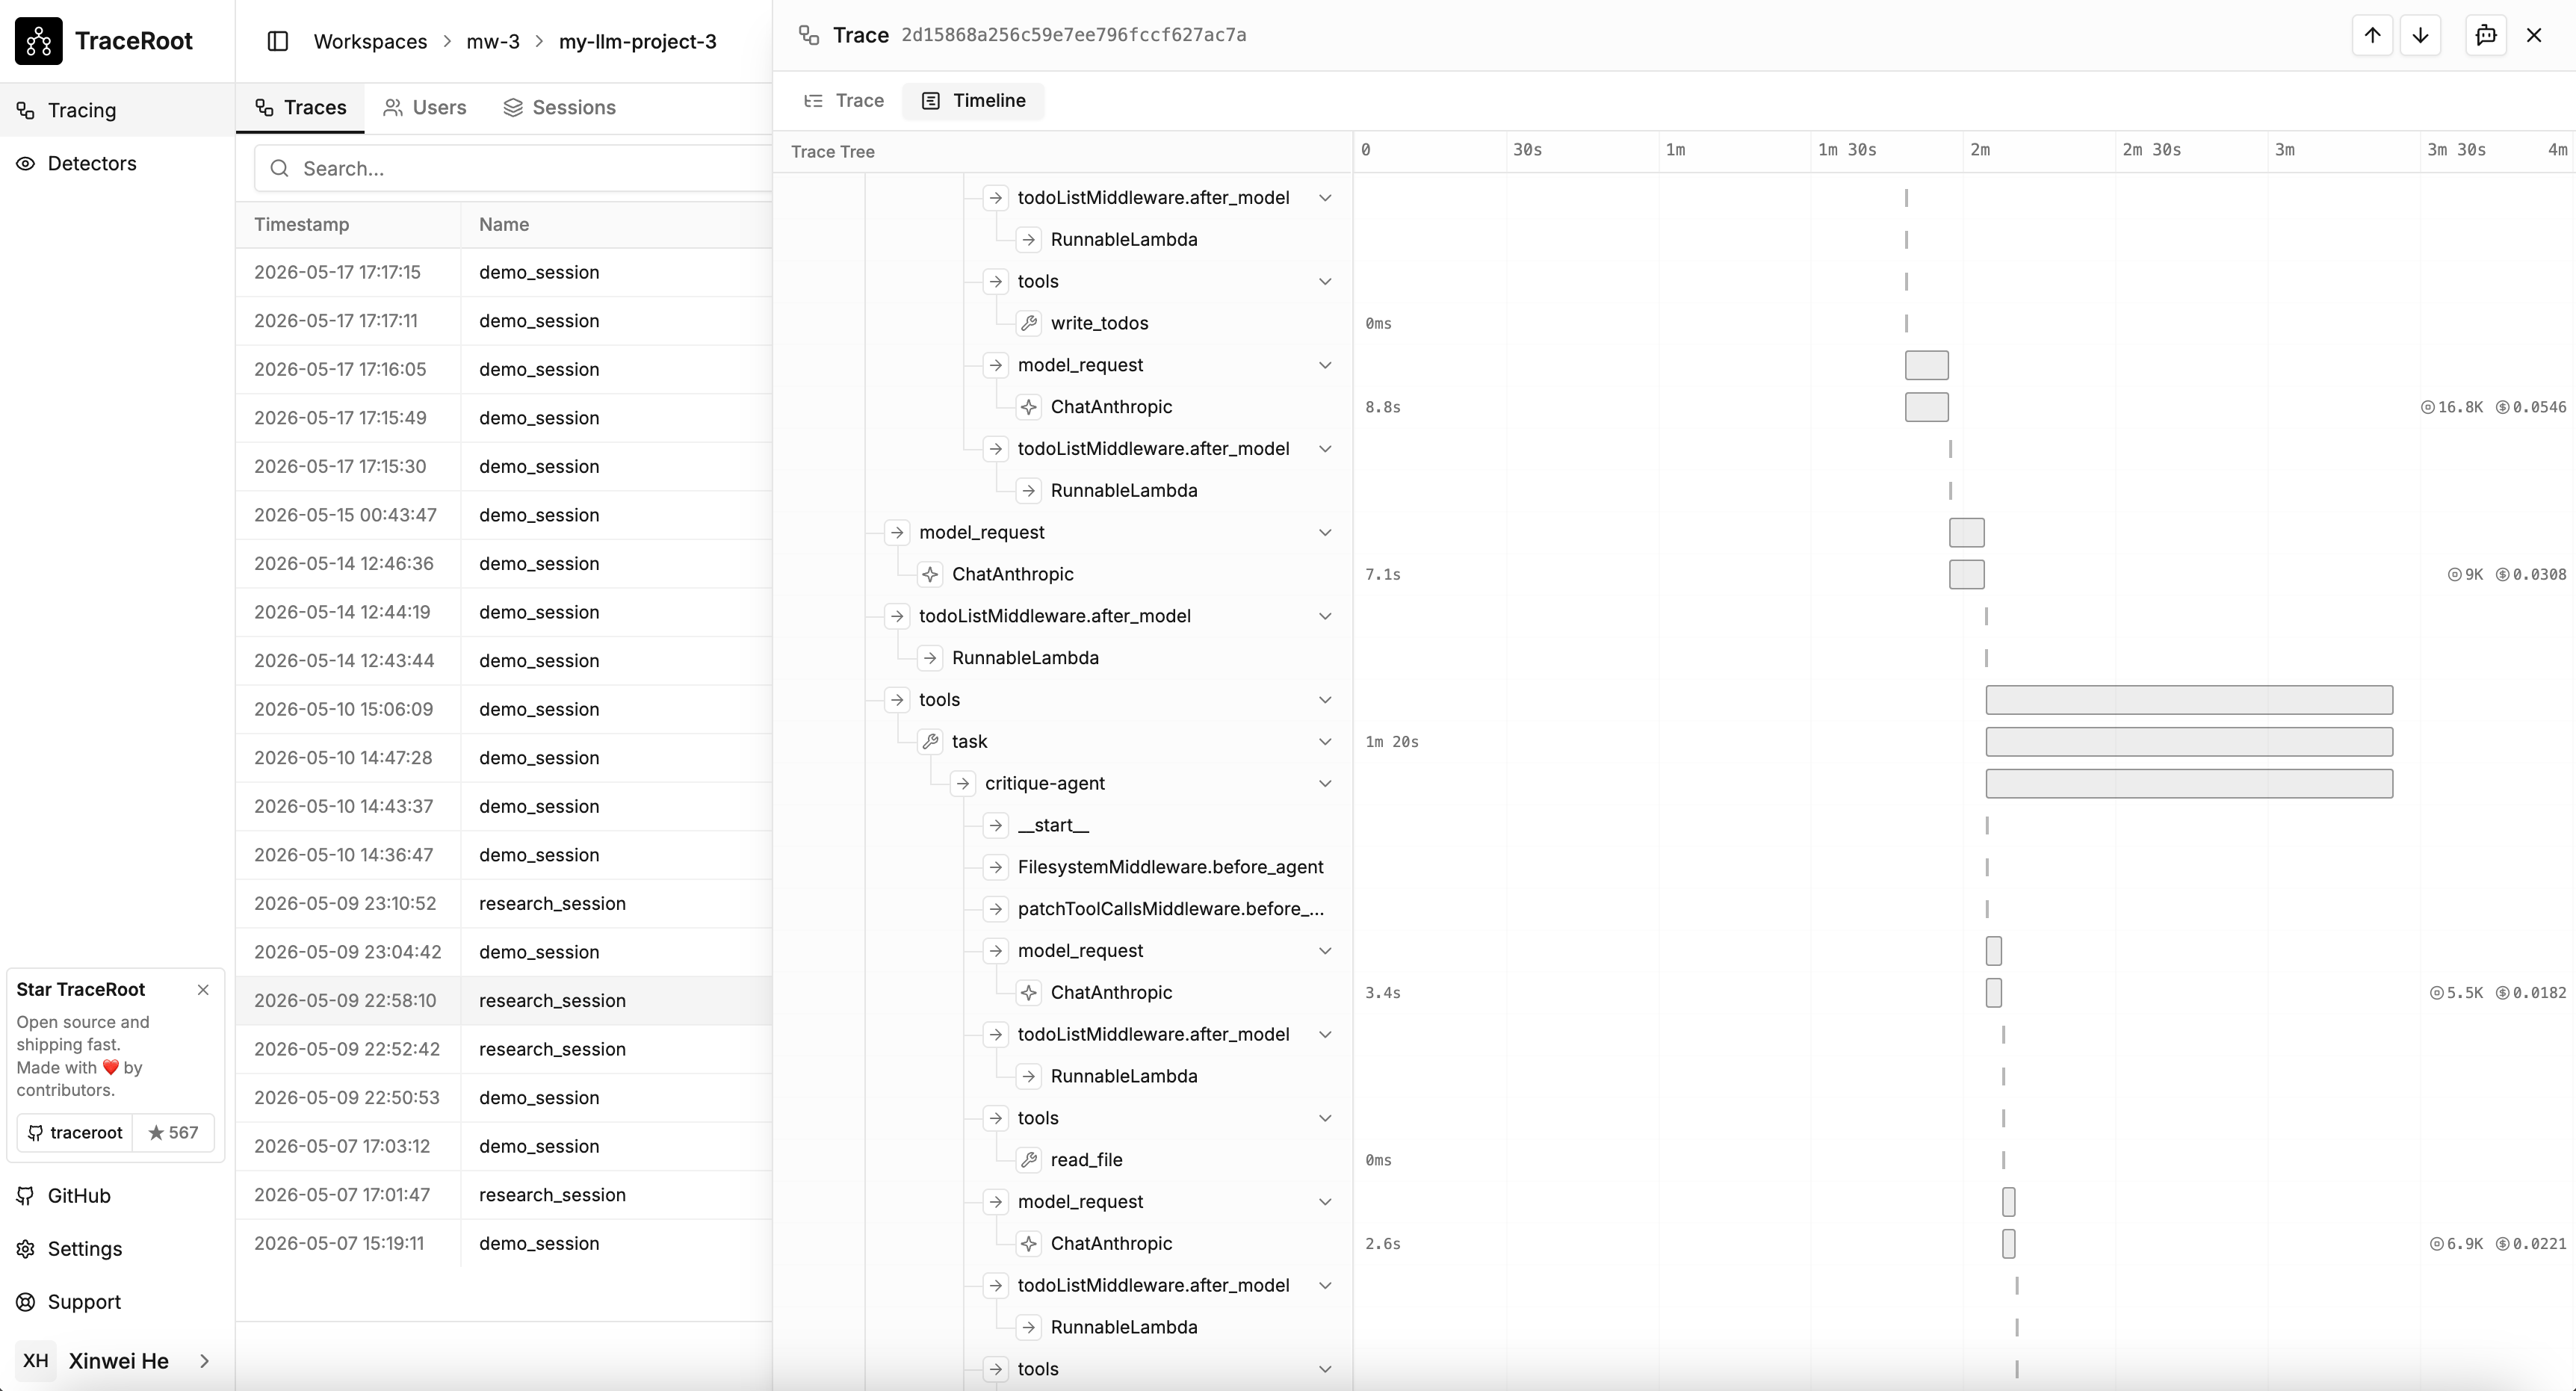
# Timeline View
> Visualize spans as Gantt-style bars over time to spot long operations, parallelism, and gaps
The trace viewer renders every trace as either a **Trace** view (hierarchical tree) or a **Timeline** view (Gantt-style bars). Both views share selection and collapse state.
 ## Trace vs Timeline
| Trace view | Timeline view |
| --------------------------------------------- | ----------------------------------------- |
| Call hierarchy and parent/child relationships | Span duration relative to siblings |
| Inspecting span attributes, inputs, outputs | Finding the critical path or longest span |
| Navigating nested agent or tool calls | Checking parallel vs serial execution |
## Toggling
Use the **Trace** / **Timeline** buttons in the trace viewer's sub-header. Selection persists across the switch.
## Click-to-select
Clicking a bar in the Timeline view selects the span and switches back to the Trace view, scrolling and expanding ancestors so the span is visible.
## Trace vs Timeline
| Trace view | Timeline view |
| --------------------------------------------- | ----------------------------------------- |
| Call hierarchy and parent/child relationships | Span duration relative to siblings |
| Inspecting span attributes, inputs, outputs | Finding the critical path or longest span |
| Navigating nested agent or tool calls | Checking parallel vs serial execution |
## Toggling
Use the **Trace** / **Timeline** buttons in the trace viewer's sub-header. Selection persists across the switch.
## Click-to-select
Clicking a bar in the Timeline view selects the span and switches back to the Trace view, scrolling and expanding ancestors so the span is visible.