An anatomy of a detector
A tool call returns 200, the answer is still wrong, and nothing pages anyone. Here is what runs when TraceRoot judges a trace — and the three decisions behind it.
 Xinwei HePublished
 A tool call returned 200 with a valid body, the model read it and drew the wrong conclusion, and the user got a confident answer built on it. No error, no timeout, no threshold crossed. Nothing paged anyone.
Everything that watches your agent today is built for the other kind of failure: latency over a limit, error rate over a limit, tokens over a limit. Those are deterministic rules, they are good at what they do, and TraceRoot has them on the Alerts tab. The failure above is not a number going over a line. It needs judgment.
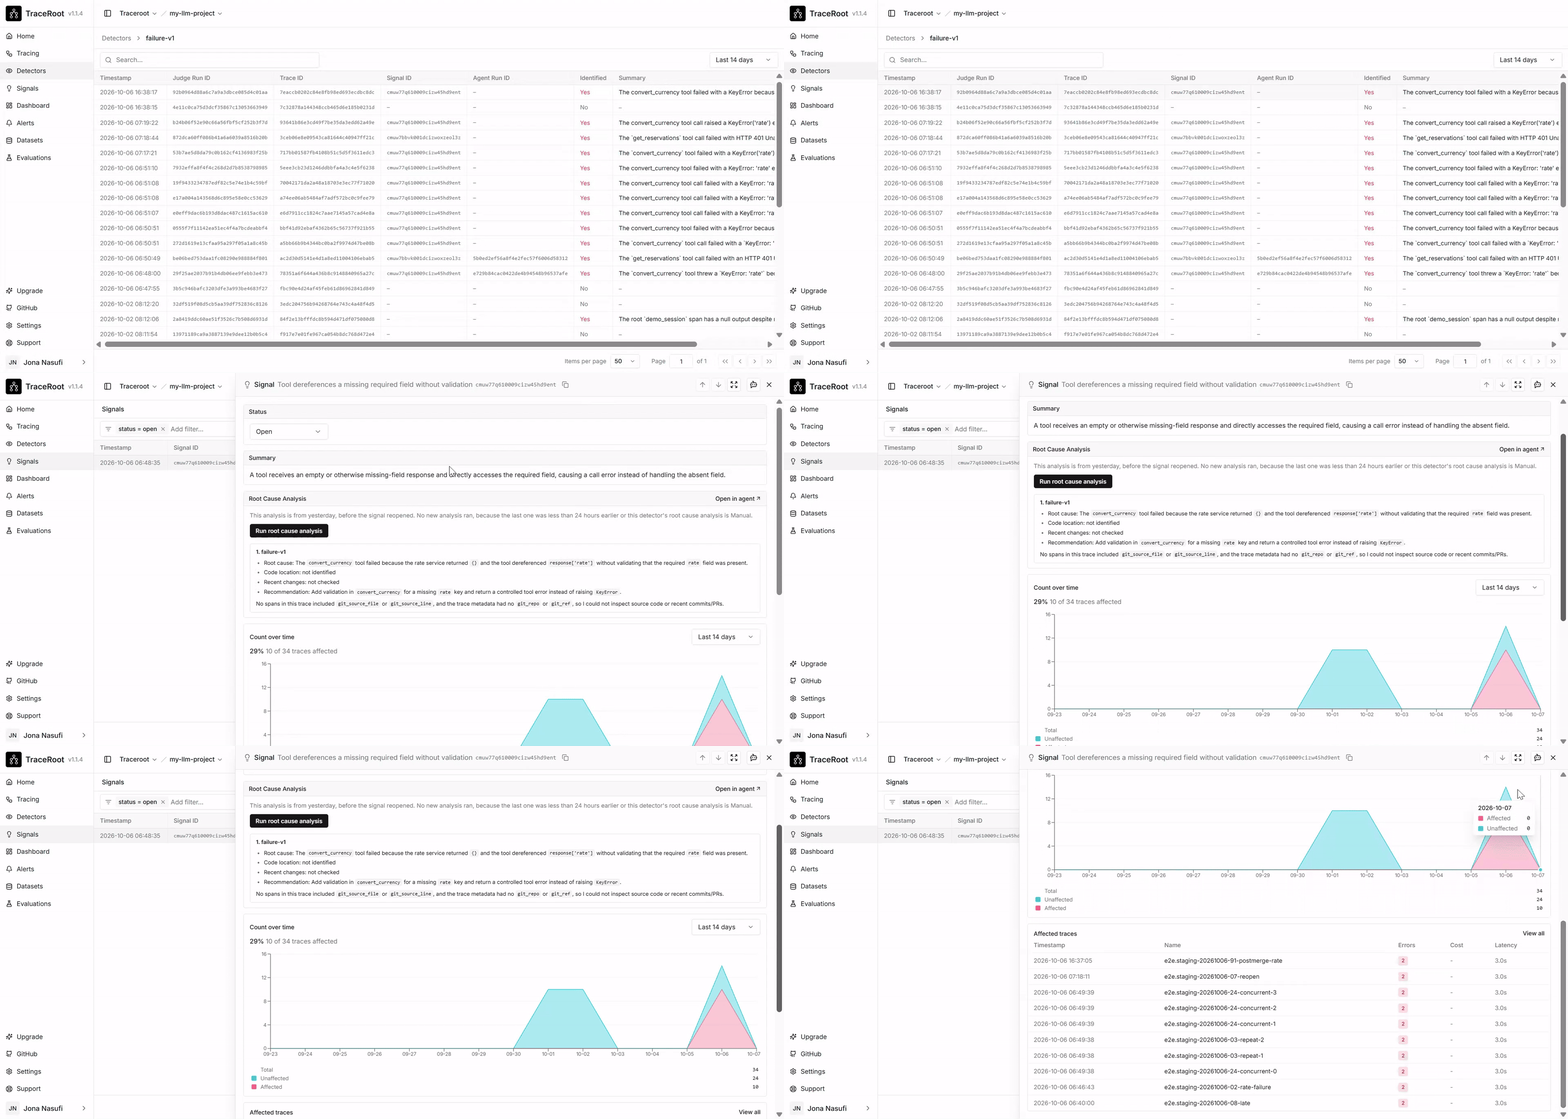
A detector is the layer that supplies it. Here is the whole pipeline before we take it apart:
Matching traces are sampled and judged. Flagged runs produce findings, which can join Signals for root cause analysis and digest notifications.
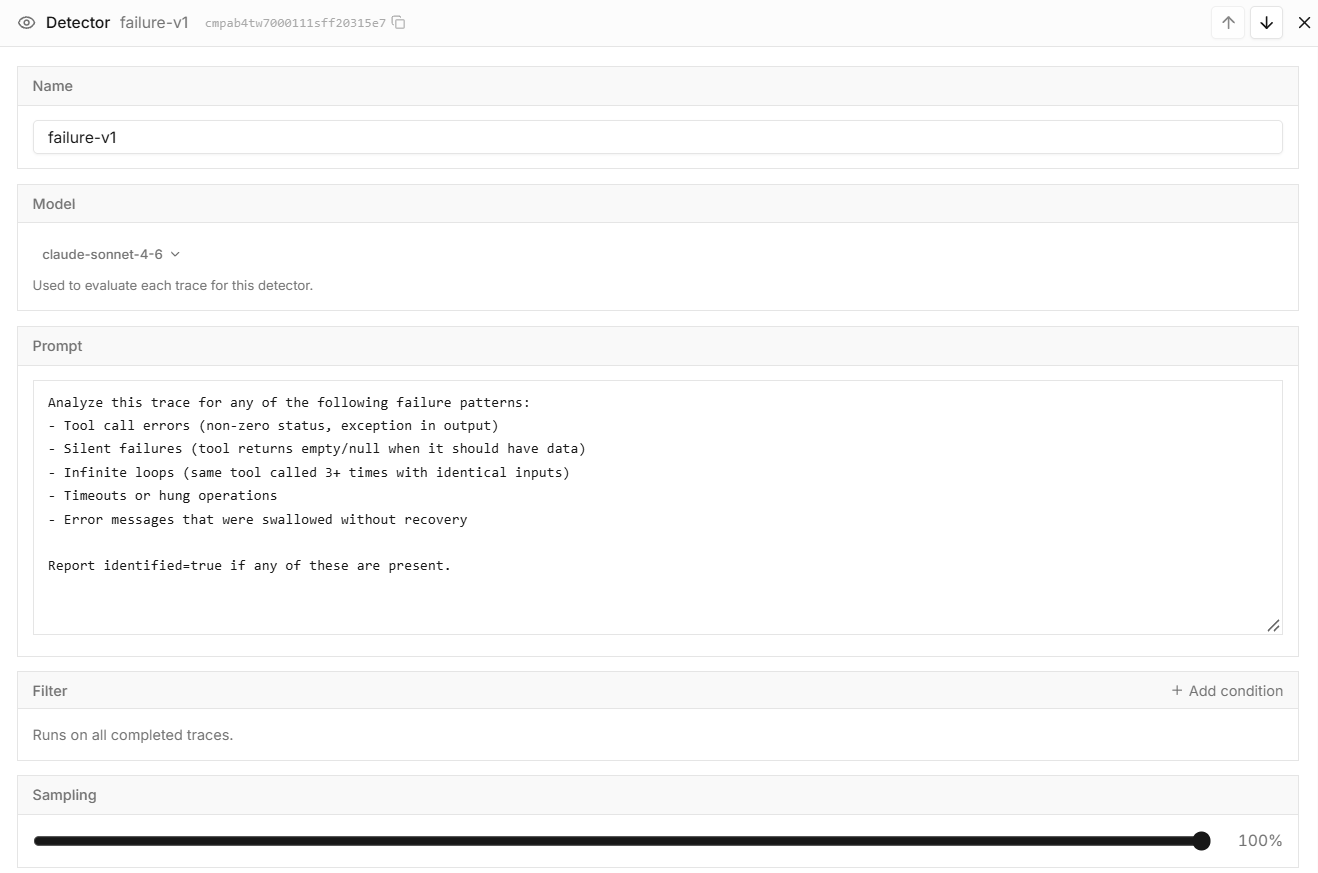
What a detector is made of
| Part | What it controls | Default |
|---|---|---|
| Output schema | The structured judge result, including the boolean identified outcome |
editable |
| Detection model | Which model judges the trace | Claude Haiku by default; system or BYOK model |
| Prompt | The problem to look for, in natural language | supplied by a starting template, editable |
| Trigger conditions | Which incoming traces qualify for evaluation | configure for the traffic you want to inspect |
| Sampling rate | How much of the matching traffic gets judged | 25% |
| Generate signals | Groups findings for the same recurring problem | on; new findings only |
| Root cause analysis | When the AI agent investigates a Signal | Automatic; choose Manual to run it yourself |
Three decisions, and what we rejected
Why sample instead of judging everything? A detector is a model call per run. Judging all of production is the version of this feature that sounds better and costs more than the bugs it finds. Sampling at 25% with conditions on top means the judge is spent where a judgment is worth having, and you can raise it on the detectors that earn it. The honest trade: a detector is a smoke alarm, not an audit. It is built to find a failure mode, not to certify every run.
Why a second agent instead of a smarter judge? The judge decides whether a problem is present in the trace. The investigation is a separate step: the AI agent reads the trace, production source code and recent GitHub activity to explain the failure and recommend a change. Choose the judge and agent models independently, using a system model or BYOK for either stage. A cheaper judge can screen traffic while a stronger agent investigates Signals that need attention.
Why propose a change instead of applying one? The agent can open a pull request and cannot merge. A suggested prompt or model change is itself non-deterministic; shipping it automatically would mean an unreviewed, unverified change to production behavior on the say-so of a model. The loop we want ends in a number you can check, not in a silent commit.
From a finding to a Signal
When the judge returns identified: true, TraceRoot records a finding. With Generate signals enabled, findings from the same detector that describe the same recurring problem join a Signal. Grouping is on by default. Turning it on later groups new findings; it does not backfill earlier ones.
Root cause analysis runs per Signal. Automatic is the default: a new Signal starts an investigation, and a resolved Signal can trigger another when it reopens. Manual runs the agent only when you click Run root cause analysis on the Signal. The agent uses the trace, production source code and recent commits and PRs to produce a code location and recommendation. Read that analysis on the Signal; you can also run it there if an earlier attempt failed. A finding joining an open Signal does not start another analysis. A resolved Signal reopened within 24 hours of its last analysis keeps that analysis. If several detectors open Signals on the same trace, one agent run covers them, with a section for each detector.
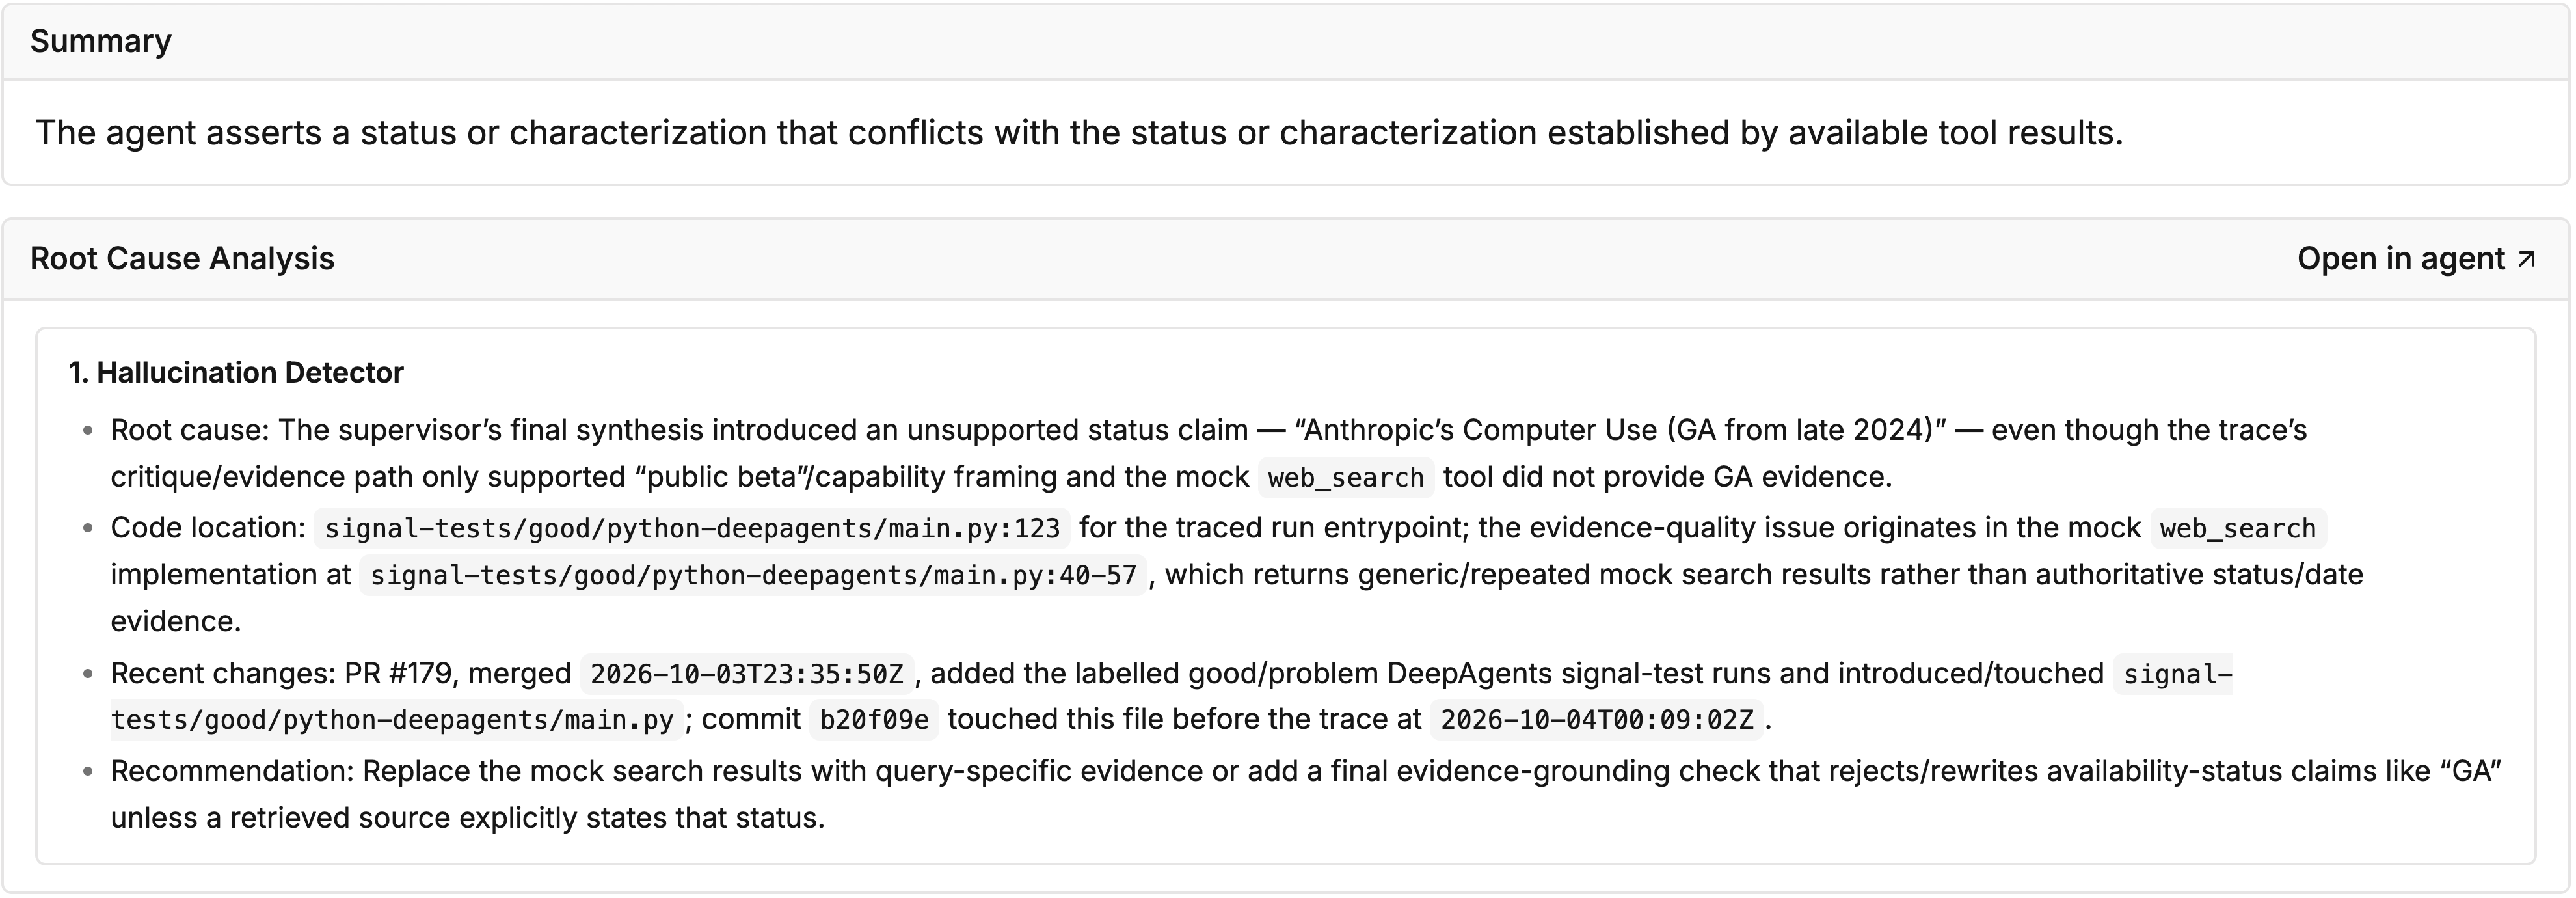
The final answer claimed general availability even though the earlier evidence supported public beta. The investigation traced the unsupported claim to mock search results and recommended checking availability claims against retrieved sources. Open full-size analysis.
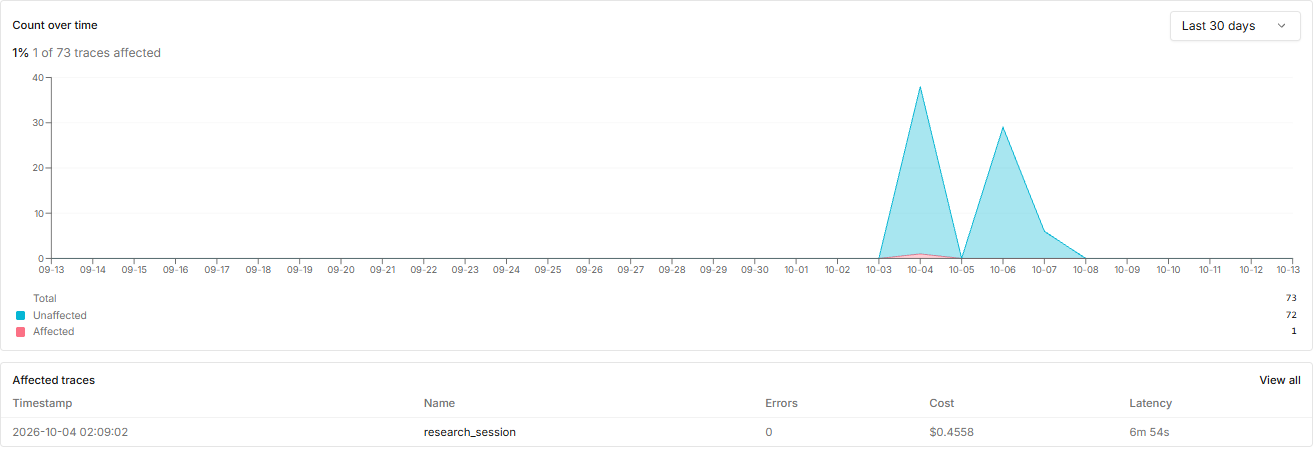
The same Signal’s 30-day view shows one affected trace out of 73. The affected-traces table identifies the research_session run to inspect alongside the analysis.
Where the Signal lands
Findings record what the judge identified; Signals organize recurring problems and hold their root cause analysis. Here is where to read them:
- In the app, on the Signals page. A finding links to the Signal it joined; the Signal holds the analysis even when that finding did not trigger its own agent run.
- In Slack or email, in a project digest announcing new and reopened Signals. The default window is ten minutes. Each entry includes a title, short summary, detector, hit count and link. Delivery follows the window and never waits for RCA; analysis results stay on the Signal.
- Notification settings live under Project Settings → Detectors → Notifications. Configure email recipients and the digest window there; connect Slack and choose its destination channel under workspace Settings → Integrations. Without recipients or a Slack channel, nothing is sent. Manual versus Automatic RCA does not change notifications.
- In your terminal, through
traceroot findings get, which puts it in the session where the fix gets made. That is the loop the CLI post walks through.
What to know before enabling it
Grouping changes the notification unit. More findings on an open Signal update its hit count without another announcement; dismissed Signals stay silent. A Signal reopens when a trace started after it was resolved hits the problem again. With Generate signals off, the detector records findings only: no Signals, RCA or notifications. On self-hosted deployments, grouping and RCA require OPENAI_API_KEY.
The verification half is manual. You can pull a finding into Claude Code or Codex through the CLI and run an offline eval against the suggested change before opening a PR. Nothing does that for you yet. The direction is a loop where every suggestion ships with a before-and-after number.
So, what would a detector catch in your traffic?
Thresholds catch the failures that look like failures. A detector catches the ones that look like success, and a coding agent with the trace and the production commit turns that catch into a change you can check.
Keep your alerts. Add the layer that reads the answer.
Related: TraceRoot CLI: talk to your traces from your coding agent, detector docs, CLI docs, Discord, and the TraceRoot GitHub repo.