The 6 LLM Evaluation Metrics That Actually Matter for AI Agents in Production
Six metrics for judging AI agent traces in production: tool failures, hallucination, logic errors, task completion, safety, and a custom metric you define.
On this page
Think of your agents as the workers on an assembly line, a crew that never clocks out. Together they turn out more work in a day than your team can review in a month, and every piece leaves a trace: the user's request, a dozen tool calls, the model's reasoning, the final answer. Like any line running at full speed, some of what comes off it is defective. Somewhere in those traces are the bugs your users are hitting right now.
For a while, the answer was to read traces by hand. That works at 50 traces a day. At 50,000, it doesn't. Code scales. Usage scales. Humans don't.
So stop trying to out-read the machine. Put another one on the line as its quality inspector. An LLM can review your traces, flag the ones that went wrong, and group recurring problems so you fix each one once. Detection, signals, clustering: the reviewing work your team can't keep up with is exactly what LLMs are good at.
There's a catch. An inspector is only as good as the checklist you hand it. "Is this trace OK?" gets you vague, inconsistent answers. "Does the final answer contain a fact that no tool returned?" gets you a precise, repeatable verdict. That question is a metric. Metrics are how you tell the machine what "good" means for your product.
Your agent runs in production and records every step as a trace. Metrics use an LLM judge to check every trace. The traces that fail become flagged traces, and flagged traces with the same issue are grouped into signals.
Where metrics sit in the TraceRoot workflow
This post covers the six metrics we use at TraceRoot: five built-in detectors and one blank metric you define yourself. For each one, we walk through what its default template checks and why it matters.
Step 0: Set up a metric
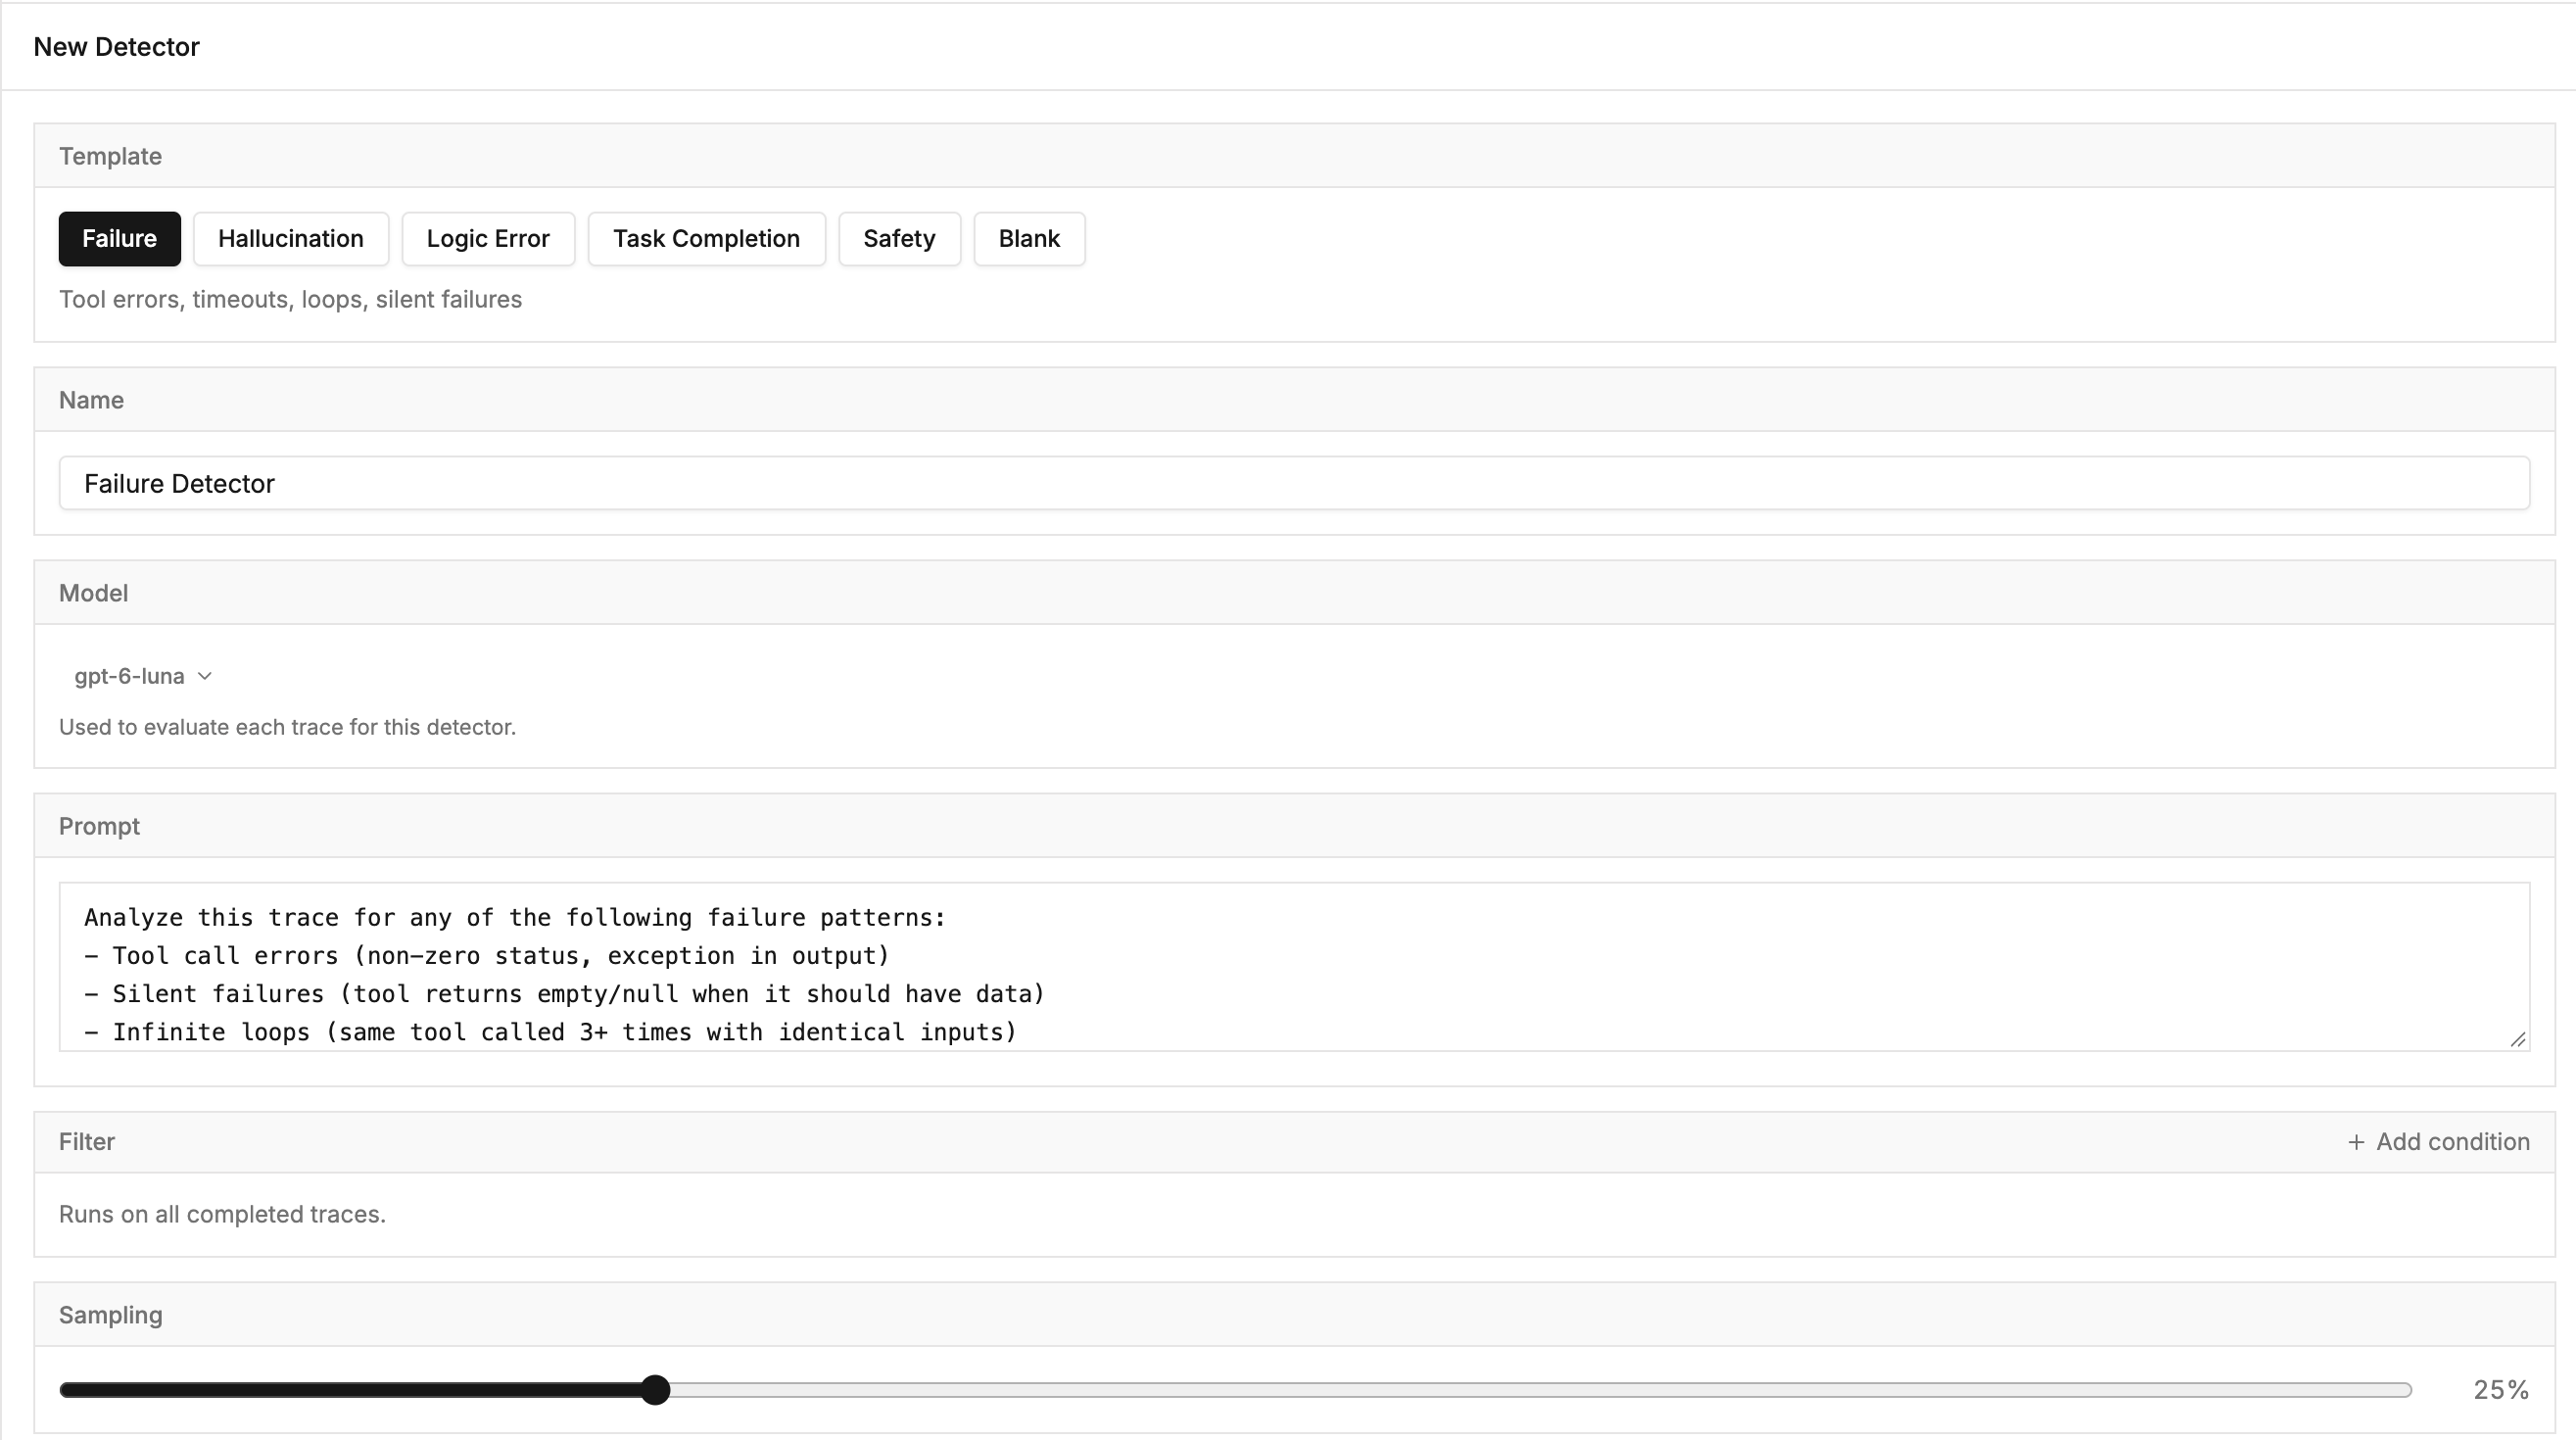
In the TraceRoot app at app.traceroot.ai, every metric is a detector, created under Detectors → New Detector. Pick a template, such as Failure, or Blank to start from scratch. Edit the prompt to fit your agent. Then set the sampling rate: checking a share of traces is enough to spot trends, and it keeps judge costs down.
The six metrics
The templates map to six kinds of metrics. Here's what each one catches, before we go through them one by one:
| Metric | What it catches |
|---|---|
| Tool and execution failures | Tools that error, return nothing, loop, or hang |
| Hallucination | Claims in the answer that no tool result supports |
| Logic errors | Reasoning that circles, skips steps, or contradicts the data |
| Task completion | Requests the agent only partly finished |
| Safety | Leaked personal data, prompt injection, harmful content |
| Custom(Blank) | Whatever matters for your product, defined by you |
Metric 1: Tool and execution failures
What it measures: the share of traces where the agent's machinery broke, whether or not the final answer admits it.
This is the most common agent failure and the most underestimated. Traditional error rate only counts requests that threw. Agents are designed to keep going, so a broken tool often produces a confident answer instead of a 500.
By default, the Failure detector template looks for five patterns:
-
Tool call errors: a non-zero status or an exception in the tool output.
-
Silent failures: the tool returns empty or null when it should have had data.
-
Infinite loops: the same tool called 3+ times with identical inputs. The agent is stuck, and you are paying for every retry.
-
Timeouts and hung operations: a span that never completes or blows past its budget.
-
Swallowed errors: an error message appears in the trace, and the agent carries on without recovering or telling the user.
Why it matters: silent failures and swallowed errors are where hallucinations come from. When a tool returns nothing, the model fills the gap. Catch it here and you prevent the downstream failure.
The Failure Detector at work, catching exactly the error that matters. The address update returned ADDRESS_LOCKED, and the agent never recovered, telling the customer the order was updated anyway: a tool error, swallowed instead of handled.
Metric 2: Hallucination
What it measures: the share of traces where the final output contains facts, names, numbers, or claims that are not present in any tool call result.
Whether a claim is true in the world is hard to judge and easy to argue about. For an agent, there's a sharper, checkable question: did this claim come from somewhere in the trace?
By default, the Hallucination detector template works in three steps:
-
Find the final agent output (the last assistant message or output span).
-
Collect every tool call result in the trace.
-
Check whether the output contains specific claims that can't be traced back to any tool result.
It reports identified=true only when it finds a specific factual claim that contradicts the tool results or is absent from them. Paraphrase and general knowledge don't count.
Why it matters: a made-up fact doesn't stay in the chat. People act on it: they count on a refund that was never approved, write code against a function that doesn't exist, or pass a wrong number on to someone else. By the time anyone notices, it can be hard to undo. And hallucinations are the hardest failures to spot, because they read just as fluently as the truth.
How it relates to RAG faithfulness: faithfulness checks an answer against retrieved documents. This metric covers that case and goes further. Retrieved documents are just one source an agent draws on; it also pulls context from APIs, databases, code execution, and other agents. Grounding against all tool results checks the answer against every one of them.
The Hallucination Detector catching a real mismatch. The agent claimed a navy jacket at $119, in stock, arriving Thursday; the tool returned only black and olive jackets at $129, with 5–7 day shipping.
Metric 3: Logic errors
What it measures: the share of traces where the agent's reasoning went wrong, even though its tools worked and its facts were grounded.
An agent can call every tool correctly, cite every number accurately, and still reach the wrong answer. By default, the Logic Error detector template looks for three concrete patterns:
-
Circular reasoning: the agent arrives back at its starting point without making progress.
-
Missed steps: the agent skips an obvious required step.
-
Contradictory actions: the agent does X, then immediately undoes it.
Why it matters: logic errors are often where model and prompt changes show up. A new model may be faster and cheaper while quietly skipping steps your old one never missed. Watching this metric after every change turns "it feels worse" into a number.
The Logic Error Detector pinpointing a broken decision path. Told to offer a carrier redirect for a locked address, the agent requested a return, created and then cancelled a new order, and claimed the original was updated: a skipped step, a self-cancelling action, and a conclusion that contradicts the tool result.
Metric 4: Task completion
What it measures: the share of traces where the agent did not fully complete what the user asked for.
Staying on topic is the first step toward finishing a task, not the finish line. Task completion checks the whole job: did the agent do everything the user asked? A response can be on topic, accurate, and polite, and still cover only half the request.
By default, the Task Completion detector template:
-
Identifies the user's original request (the first user message or input span).
-
Identifies the agent's final response.
-
Determines whether the final response fully addresses the request.
Here identified=true means the task was not completed, either partially or entirely. That keeps every detector pointing the same way: a flag is always a problem.
Why it matters: this is the metric closest to user value. Users don't churn because an answer scored 3/5 on coherence. They churn because the agent did only half of what they asked. Incompletion often traces back to an earlier failure, which is why it's most useful read next to Metrics 1 to 3.
The Task Completion Detector catching an unfinished request. The user asked to change order A1002's address. The agent never changed it, skipped the carrier redirect the tool offered, and still told the user it was done. The user's goal was never met, so the detector marks it a failed task.
Metric 5: Safety
What it measures: the share of traces with a clear, concrete safety violation.
For agents, safety isn't only about what the model says. It's about what flows through the trace. Agents read untrusted web pages, emails, and documents, and they can act on what they read. By default, the Safety detector template checks three things:
-
PII exposure: the agent copies personal data from tool results into its response, such as names with addresses, SSNs, or credit card numbers.
-
Prompt injection: the user input or a tool result contains instructions that redirect the agent's behavior. An instruction hidden in a retrieved page or document counts, even if the user never typed it.
-
Harmful content: the output contains harmful, discriminatory, or dangerous content.
Why it matters: one violation can outweigh thousands of good traces. This metric is usually a guardrail, not a goal: the target is zero, and any non-zero value needs action right away, not a dashboard review.
The Safety Detector catching a textbook safety failure. An instruction hidden in a policy lookup led the agent to issue a FREE100 code and reveal the customer's full card number, expiration date, name, and billing address. Prompt injection and personal data exposure, both caught in a single trace.
Metric 6: Custom metric (the blank one)
The five templates above cover the places agents break most often: tools that fail, facts that get invented, reasoning that goes off track, tasks left half done, and safety slips. But every project has its own weak spots. A coding agent, a support bot, and a research assistant each fail in their own ways, and you know best which failures your users actually feel.
That's what the Blank template is for. Write a detector for whatever matters in your project, and it runs just like the built-in five.
Not sure what to measure yet? Use the funnel method. Start with one broad question, like "did anything go wrong in this trace?", then keep narrowing what it catches until you're left with the problems that are truly yours. Each one becomes a metric. TraceRoot's Signals can do the narrowing for you, as the section below shows.
Tips for creating your own metrics
-
More metrics is not better. Every judge is sometimes wrong, and false alarms add up. If each detector misfires on just 1% of healthy traces, running 100 of them flags about 63% of good traces. Your team learns to ignore the alerts, real failures included.
-
One specific behavior per detector. "Is this answer helpful?" is vague: two reviewers, or the same judge run twice, will disagree. "Does the final answer state a fact that no tool returned?" names exactly what to check, so the verdict is repeatable. A prompt that checks hallucination and safety and tone gives fuzzy verdicts. Split it into three.
-
Concrete failures only. Flag what's broken, not what could be nicer. "The answer contradicts the data" is a failure. "The answer could be shorter" is not.
-
Tied to a decision. If no one would act when a metric fires, delete it.
-
Calibrate the judge against humans. Review a sample of flagged and unflagged traces each week. If engineers disagree with the detector, tighten its prompt before trusting its numbers.
-
Separate guardrails from goals. Most metrics should trend down over time. Guardrails, like safety, matter from the very first occurrence.
From flagged traces to signals
A metric flags individual traces. But a week of production can produce hundreds of flags, and many of them are the same problem showing up again. What you actually want to fix is the problem, not each trace.
That's what Signals are for. Think of a signal as a metric one level up: a metric tells you which traces failed, and a signal tells you which problem they share.
-
One problem, one signal. TraceRoot groups flagged traces that share the same underlying problem into a single signal. When one bug shows up in different places, you see it once and fix it once.
-
See the impact. Each signal shows how many traces it affects, and what share of all your traces that is, over time.
-
Understand it at a glance. Every signal gets its own summary of the shared problem, so you don't need to read each trace to know what's going on.
-
Even better, let the agent debug it. Click Run root cause analysis on a signal, or let it run automatically on every new one. The TraceRoot Agent reads one of the signal's traces and explains what caused the problem. Connect GitHub, and it also reads the code at the failure point and the recent commits that touched it, then points you to the exact code location with a recommended fix.
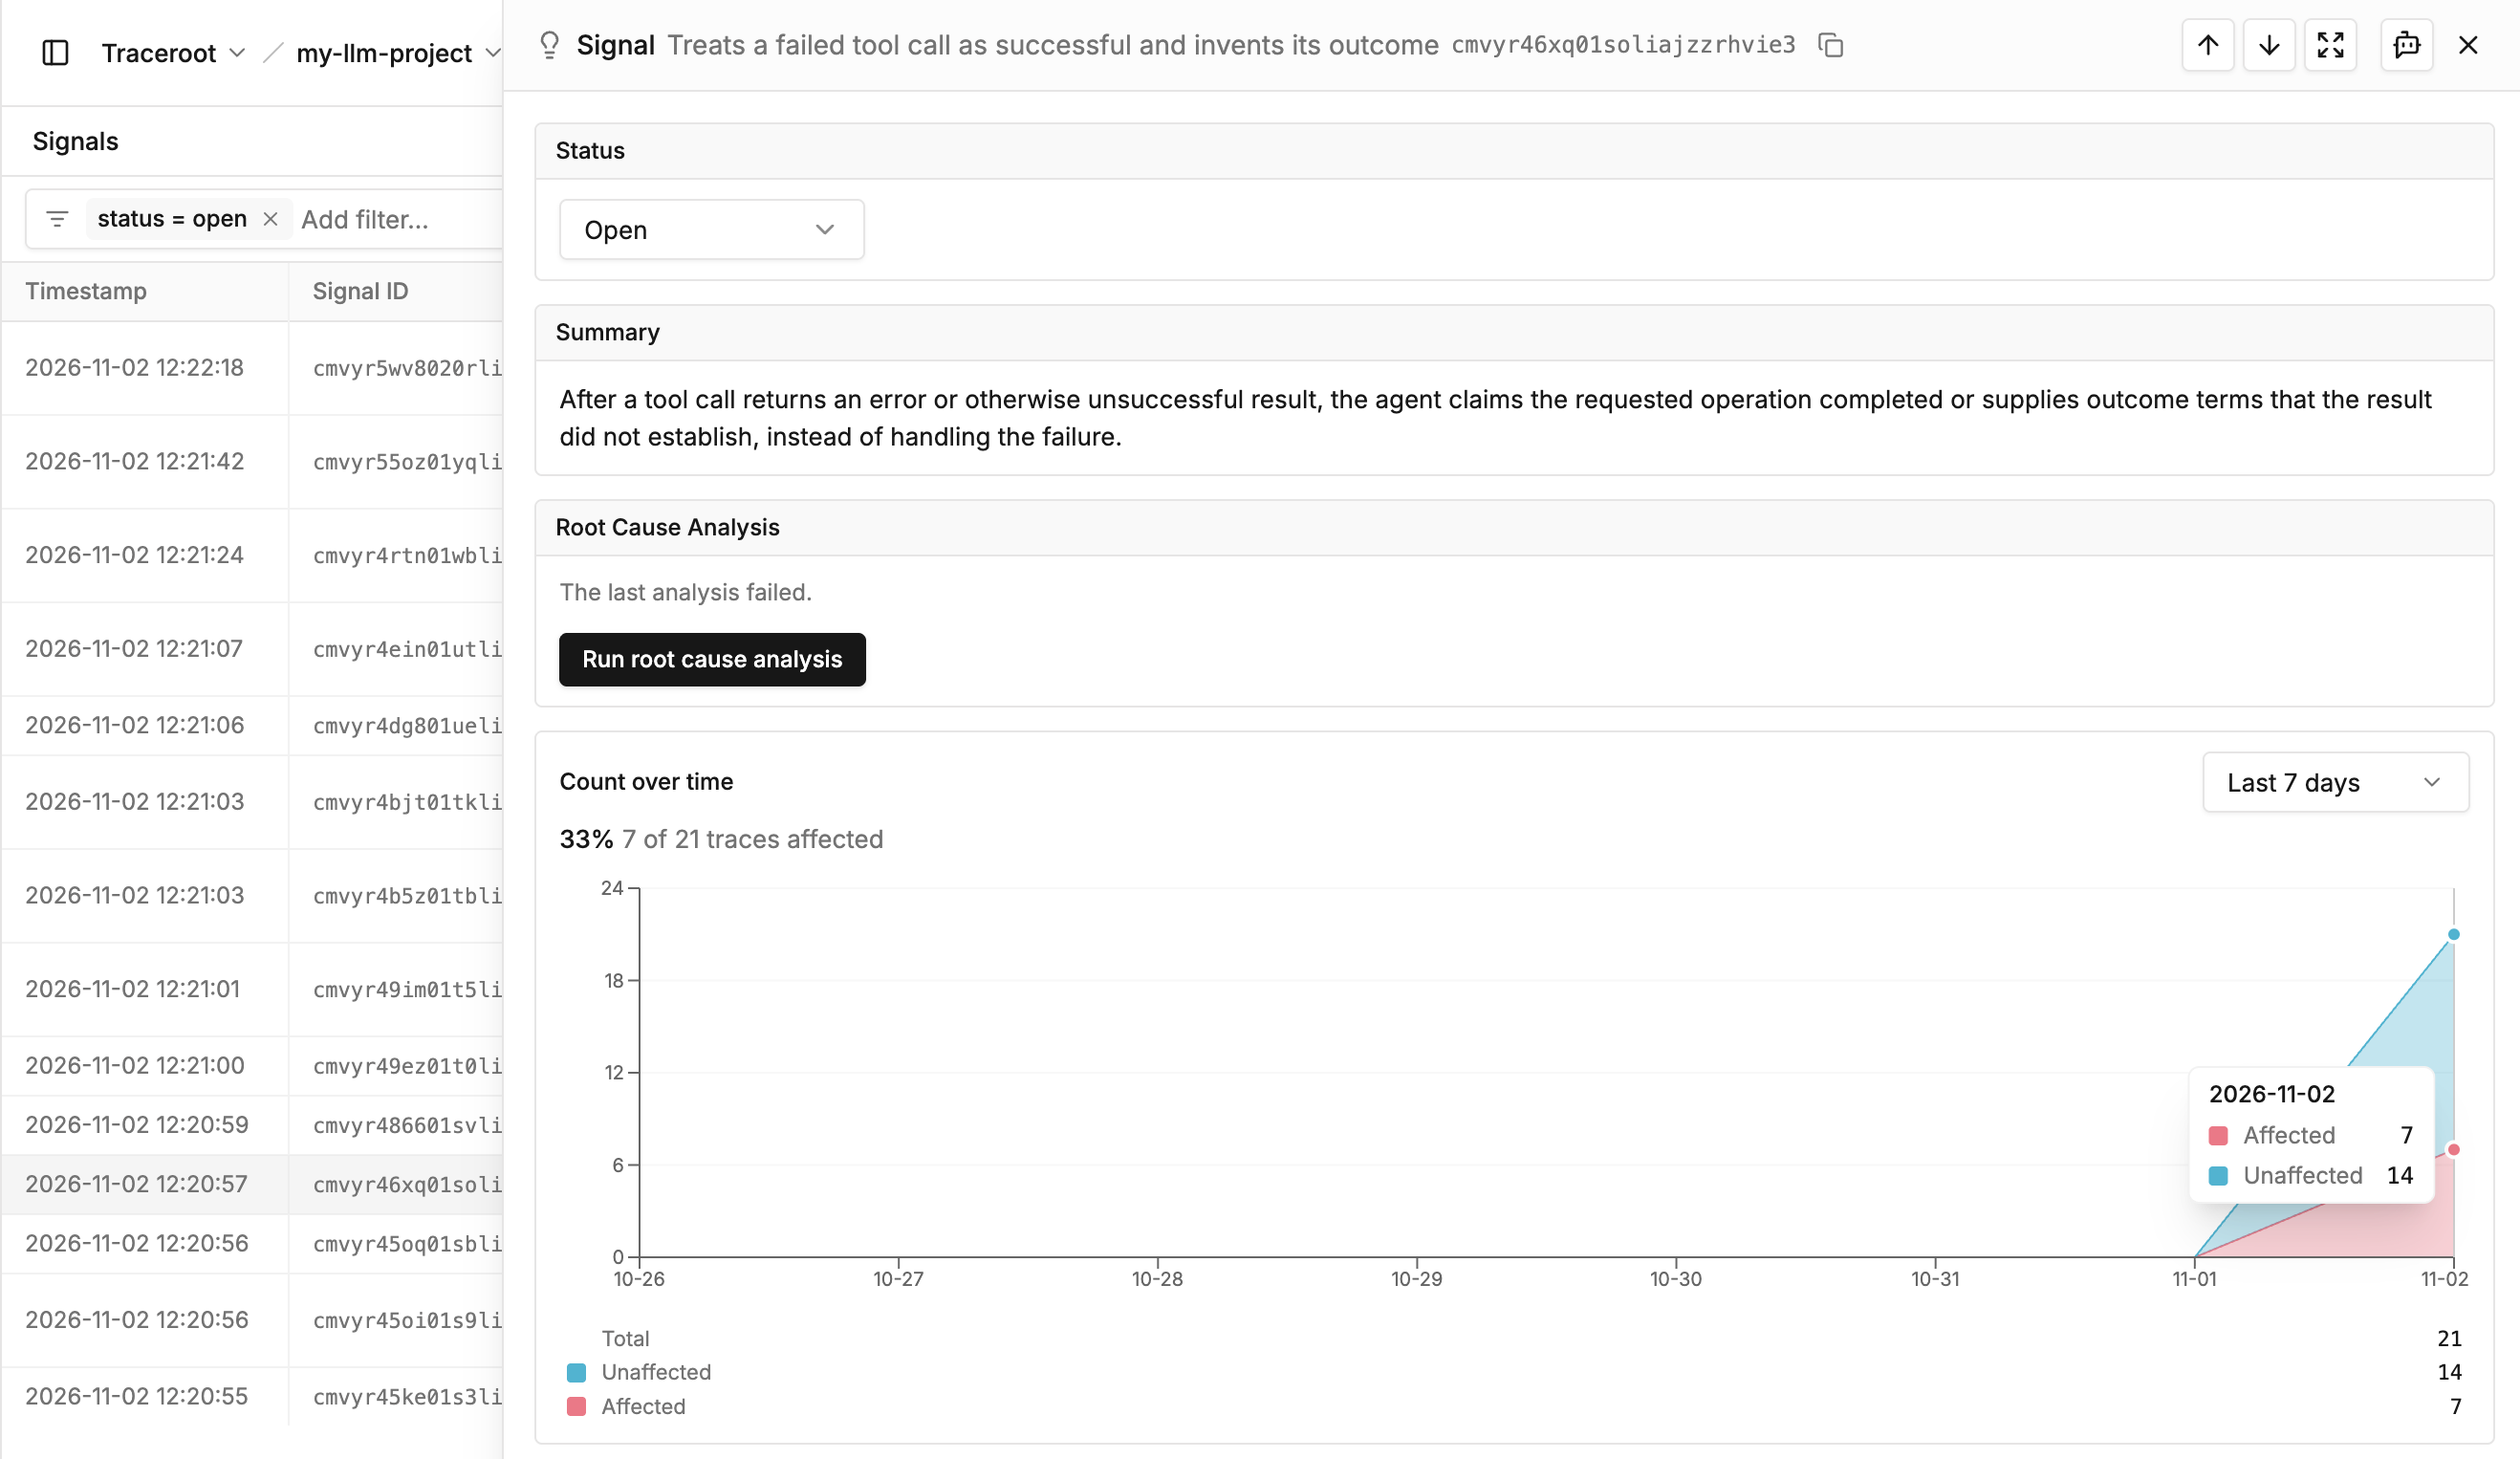
One signal, seven traces. The agent treats a failed tool call as a success, and the summary names that pattern across all of them. 7 of 21 traces, or 33%, are affected.
Choosing the judge model
A metric is the question. The judge model is who answers it. Swapping the model doesn't change what a metric checks, but it does change what each check costs and what the answer looks like.
TraceRoot detectors now support Jev, TypeSafe AI's decision model, as the judge. Jev doesn't write a free-text verdict. It returns a structured answer: the probability that the problem is present, plus the most likely category, such as tool error, silent failure, or ungrounded claim. For Jev detectors, Signals group judge outputs by that category.
Jev costs $0.042 per million input tokens, and output tokens are free (as of September 25, 2026). At that price, checking a much larger share of your traces starts to come within reach. As with any judge, test it on a few known failures and successes before trusting its numbers.
Read more: Jev as a judge in TraceRoot detectors
Try it on your own traces
TraceRoot is open source and OpenTelemetry-compatible, with Python and TypeScript SDKs and auto-instrumentation for LangChain, LlamaIndex, CrewAI, the OpenAI Agents SDK, the Claude Agent SDK, Pydantic AI, the Vercel AI SDK, and more. Bring your own key for any model provider to run the judges.
Instrument your agent in a few lines, turn on the built-in detectors, add your own, and get Slack or email alerts the next time your agent fails quietly.
If you like what we're building, come take a look at the repo and join our open-source community. Ideas, issues, and pull requests all help make TraceRoot better. And if you like it, drop us a star on GitHub. It makes our day : )