TraceRoot vs. Langfuse
TraceRoot and Langfuse both trace your agent. TraceRoot is agent-native: a CLI your coding agent can drive, plus Signals and root cause analysis to improve it.
 XinweiPublished
Your agent gave a wrong answer, and every span in the trace is green. Both TraceRoot and Langfuse will show you that trace. This post compares what each one does next, from tracing and detection to a root cause and a fix.
TL;DR
Built for coding agents. TraceRoot ships a CLI made for AI coding agents. A guided setup can connect a project, help your coding agent instrument the service and check for the first trace. Later the same agent can pull a failure and any available root cause analysis into the repository it is editing. It can also read, write, edit and delete most of what you see in the UI.
Traces that know your code. TraceRoot can attach the repository and Git ref to traces, and record the file, line and function for instrumented functions, so each instrumented span records where in the code it ran.
From signals to pull request. LLM judge outputs can be grouped into Signals that reopen on regression. With repository access and a recorded commit, a root cause analysis agent can read your code and optionally open a pull request for an engineer to review.
Open source on both sides. Both are open source and self-hostable, and both ingest OpenTelemetry, so trying TraceRoot does not mean moving your stack. Run it on one agent and keep your prompts, datasets and annotations where they are.
Choose TraceRoot if you want a more agent-native product, and your agents fail by giving wrong answers while every span looks fine, and you want the path from that trace to a reviewed fix in one place, with a CLI your coding agent can drive. TraceRoot can attach a repository and commit context to a trace. Detectors judge production traffic in plain language, Signals keep related findings together, and a root cause analysis agent can suggest fixes.
Choose Langfuse if you mainly need tracing, prompt management and annotation queues in one place, with an in-app assistant for working with traces, evaluators and dashboards, and are satisfied with less AI features.
At a glance
| Langfuse | TraceRoot | |
|---|---|---|
| Open source | ✓ | ✓ |
| Self-hosting | ✓ | ✓ |
| Step-by-step agent tracing | ✓ | ✓ |
| OpenTelemetry ingestion | ✓ | ✓ |
| Python and TypeScript SDKs | ✓ | ✓ |
| Framework integrations | ✓ | ✓ |
| CLI | ✓ | ✓ |
| Cost and token tracking | ✓ | ✓ |
| Dashboards and Slack alerts | ✓ | ✓ |
| Datasets and experiments | ✓ | ✓ |
| LLM judge on production traces | ✓ Evaluators | ✓ Detectors |
| Built-in agent | ✓ Halo | ✓ Root cause analysis agent |
| Repository and Git context on traces | Via metadata | ✓ SDK Git context |
| SQL access to trace data | Self-hosted ClickHouse | ✓ Project-scoped API / CLI |
| Reads your code at the traced commit | — | ✓ |
| Opens a pull request | — | ✓ Draft pull request |
Tracing and git context
Both tools trace an agent step by step. TraceRoot can add code context to a trace. The SDK can capture the git repository and ref, and can record the source file, line and function name for instrumented functions. The ref resolves from explicit settings first, then environment variables, then GitHub Actions variables, and then local Git information. For production images without a .git directory, the repository and commit can be injected at build time.
That metadata is what makes the rest of the loop possible. With a commit SHA and repository access configured, the root cause analysis agent can inspect the revision that ran and check related commits and pull requests for an existing fix.
| Dimension | Langfuse | TraceRoot |
|---|---|---|
| Repository and Git ref on traces | Release field, commonly set to the git commit hash | Captured by the SDK when available or configured |
| File, line and function for instrumented functions | — | Recorded on each instrumented function |
| OpenTelemetry-based instrumentation | SDKs based on OpenTelemetry | Yes |
| Live view of in-flight spans | — | On by default |
| Trace export with git context | Traces through the public API, CLI or blob storage export | Export includes the trace, spans, Git context and a finding when available |
Detectors and Signals
A detector is a plain-language description of one problem that a judge model checks production traces against, such as a failure, a hallucination, a logic error or an unfinished task. TraceRoot ships templates for these, and you can start from a blank one. You set a filter and a sampling rate, and the judge checks eligible traces after their last span arrives.
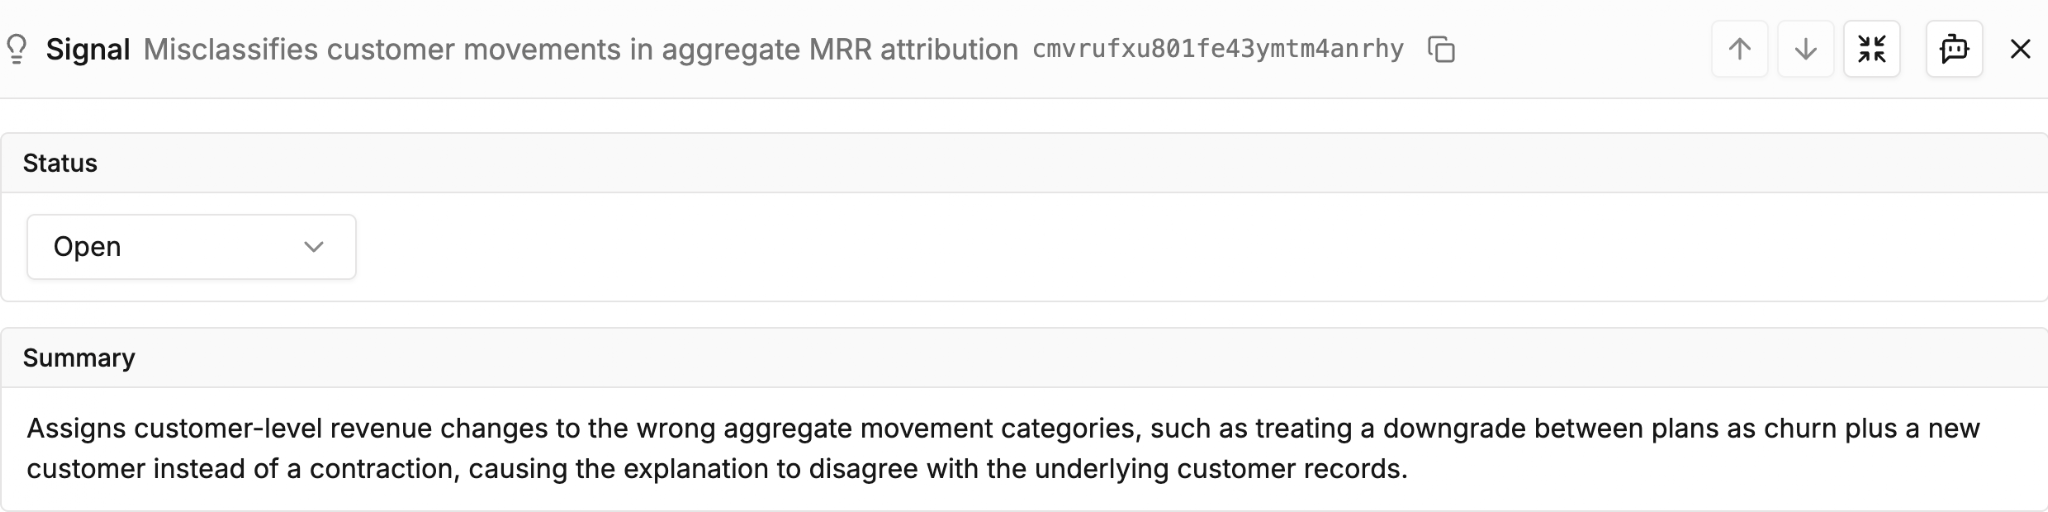
When a detector says yes, the result is a finding. When Signal generation is enabled, related findings can be grouped into one Signal. A Signal is Open, Resolved or Dismissed, and a Resolved Signal reopens by itself when a newer trace shows the problem again. Email and Slack digests list only new and reopened Signals, so a team sees what changed instead of every trace that matched.
| Dimension | Langfuse | TraceRoot |
|---|---|---|
| Detectors in plain language | LLM-as-a-judge evaluators from a template or a blank prompt | Templates for failure, hallucination, logic error, task completion and safety, or a blank one |
| Sampling and filters | Evaluation rules with filters and a sampling rate | Per detector, with deterministic sampling per trace |
| Findings clustered into Signals | — | Grouped by related issue, when enabled |
| Signal states | — | Open, Resolved with a reason, Dismissed |
| Reopen on regression | — | Automatic, when a newer trace shows the problem |
| Digests | — | Email and Slack, new and reopened Signals only |
| Signals API | — | List, read and update the status of Signals |
Root cause analysis and pull requests
With Signals and automatic root cause analysis enabled, a new or reopened Signal can start an investigation. You can also run an analysis manually. Further hits on an open Signal do not each start a new investigation.
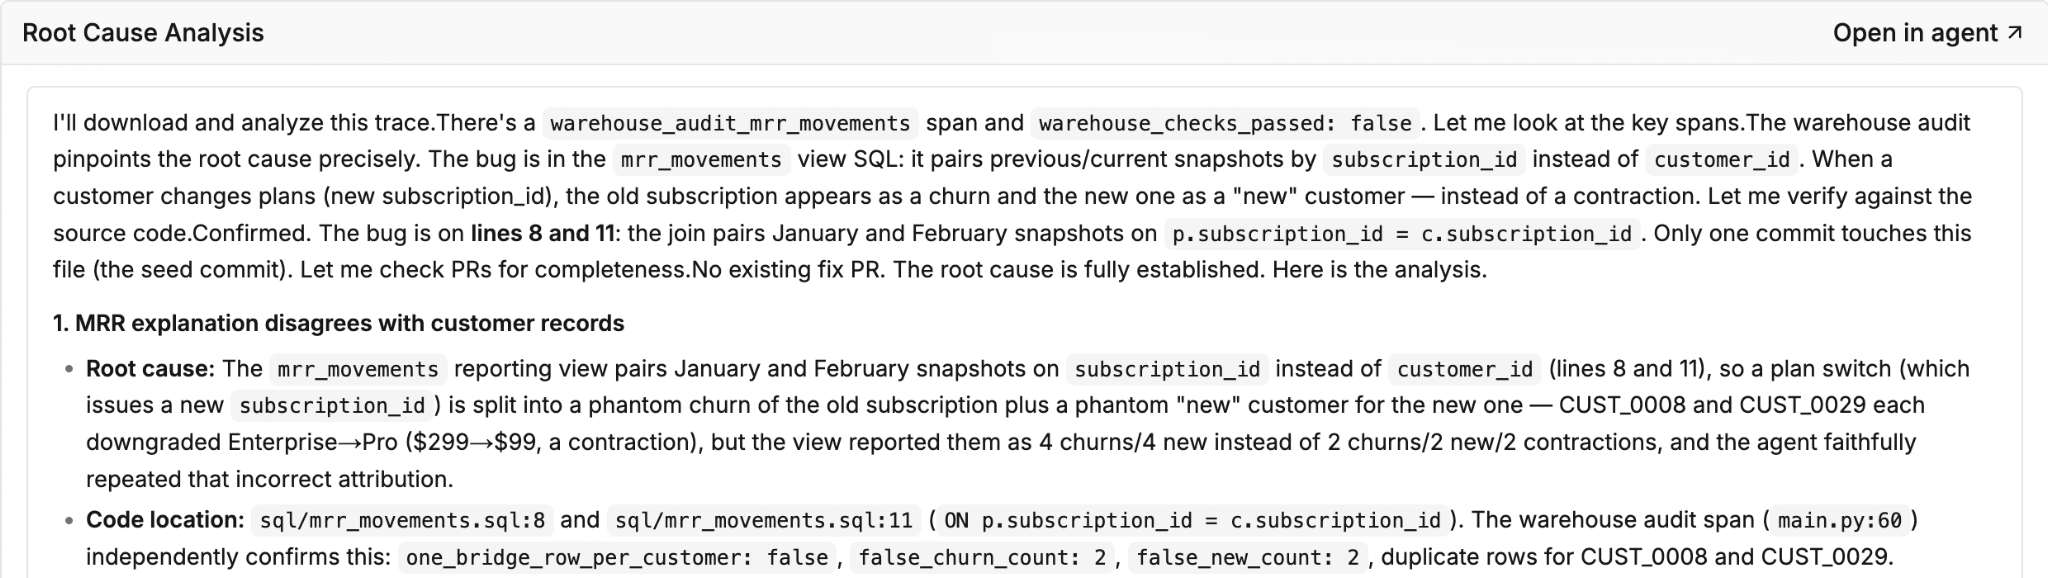
The root cause analysis agent runs in an isolated sandbox, powered by pi-mono. It examines the trace alongside a clone of your GitHub repository at the recorded commit, so it can investigate the failure against the code that actually ran. You can also ask it to write a fix and open a pull request linked to the trace.
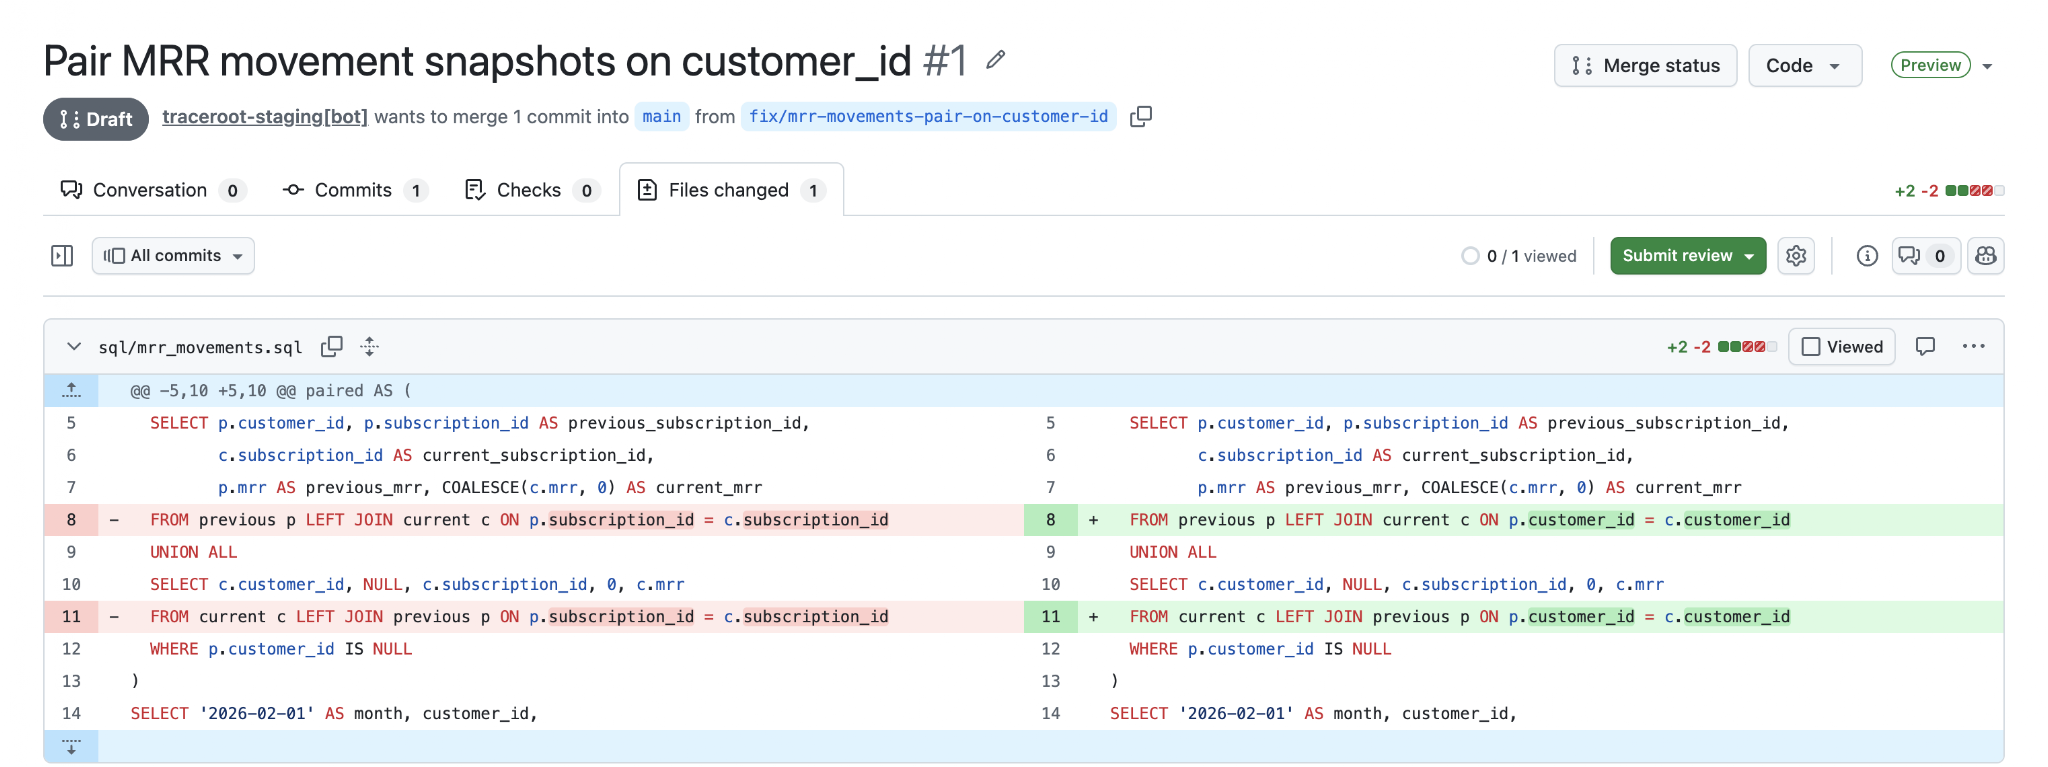
Here is what that looked like on a LangGraph SQL agent over synthetic subscription data. Asked why MRR fell in February 2026, the agent blamed four churned customers and four new ones. Two customers had actually moved from a $299 plan to a $99 plan, and every span in the trace was green. A detector compared the answer with an independent customer audit added after the agent answered and flagged it. The Signal started an analysis that identified two joins in sql/mrr_movements.sql matching on subscription_id. This was one case, and the data is synthetic.
| Dimension | Langfuse | TraceRoot |
|---|---|---|
| Analysis starts | On request, by asking Halo in the app | Automatic when enabled for a new or reopened Signal, or manual |
| Where the code is read | — | A sandbox clone at the recorded ref, with repository access |
| Isolation | Halo runs code in a sandbox | The investigation runs in an isolated sandbox |
| Pull requests | — | Opened through the GitHub App for a person to review, linked to the trace |
| Your own model | Cloud uses Langfuse-managed Amazon Bedrock; self-hosted uses the instance model you configure | Bring your own model provider key for the agent |
| Parallel analyses | Supported | Supported |
A CLI your coding agent can use
The TraceRoot CLI is built around the debug-and-fix loop and for AI coding agents as much as for people.
traceroot setup guides you through connecting a project, helping your coding agent instrument the service and checking for the first trace. traceroot instrument hands your agent a ready-made prompt for Claude, Codex or any other agent, traceroot skills install can install a selected bundled skill, and traceroot doctor checks your credentials, repository, environment and skills.
For debugging, an agent can list findings, read one together with its root cause analysis when available, and export a trace with its git context into the repository it is working in. It can also run project-scoped, read-only SQL over spans and traces through the API or CLI, including on Cloud, with parameters and CSV or file output, then export a trace for closer investigation. Sign-in is through the browser or with a project API key; the CLI supports JSON output and documented exit codes. Every delete needs a reason of 3 to 500 characters that is recorded for audit, and deleting a workspace also asks for its name, so an agent does not remove something by accident.
| Dimension | Langfuse | TraceRoot |
|---|---|---|
| Guided setup | — | traceroot setup |
| Agent-ready instrumentation | Agent Skill with instrumentation guidance | traceroot instrument for Claude, Codex or any other agent |
| Bundled skills | npx skills add langfuse/skills |
traceroot skills install |
| Health check | — | traceroot doctor |
| Findings with root cause analysis | — | traceroot findings list and get |
| Trace export with git context | Traces through the CLI, which wraps the public API | traceroot traces export |
| Read-only SQL | Self-hosted ClickHouse | Project-scoped API and CLI, including Cloud; sql schema lists fields |
| Evaluations, datasets and runs | Datasets, scores and other API endpoints as CLI commands | Read from the terminal |
| Manage detectors, alerts, dashboards and projects | Public API endpoints as CLI commands | Create, update and delete detectors, alerts, dashboards and projects; alerts also pause and resume |
| Sign-in | Project API keys in environment variables | Browser, or a project API key for CI |
Evaluation as the verify step
A fix is only done when it is checked. TraceRoot evaluations run your system over a dataset, and for runs reported to TraceRoot each case runs as a trace, so the cost and span views you use in production are there for the eval too. Scorers can be code or an LLM judge. A run can be labelled with the candidate it tested, such as a model id, a prompt version or a git SHA, and dataset versions are immutable, so a before-and-after comparison compares the same cases.
| Dimension | Langfuse | TraceRoot |
|---|---|---|
| Reported cases run as traces | Experiment runs are traced, with scores on the traces | Same span and cost views as production |
| Scorers | Code evaluators or LLM-as-a-judge | Code or LLM judge |
| Candidate label | Run name | Model id, prompt version or git SHA |
| Dataset versions | A new version on every item change, fetchable by timestamp | Immutable |
An agent inside the loop
TraceRoot's home screen is a full-page agent with persistent sessions. It can create detectors and alerts from a description, draft a dashboard widget, and work from a Signal. In an attended chat, it asks for approval before changing monitoring resources. Agent resource changes can be inspected in the workspace audit trail, where entries link to the agent session.
Which should you choose
Choose TraceRoot if you want a more agent-native product, and you run agents in production and want signals grouped, traced to the code that ran, analysed against your repository and, optionally, turned into a reviewed pull request, with a CLI your coding agent can drive.
Choose Langfuse if you mainly need tracing, prompt management and annotation queues in one place, with an in-app assistant for working with traces, evaluators and dashboards.
Both are open source, so the easiest way to decide is to run TraceRoot on one agent next to what you have.
Get started
Install the CLI and run traceroot setup in the repository of one agent. Pick one failure you have already debugged by hand, so you know what a correct diagnosis looks like, then write a detector that describes it in plain language and connect the GitHub App. The tracing quickstart covers the first step.
FAQ
Is TraceRoot a Langfuse alternative? Yes. Both are open source and self-hostable. TraceRoot clusters LLM judge outputs into Signals, investigates failures using your traces and the code that ran, and can optionally open a pull request for review.
Do I have to move everything from Langfuse? No. Start with one agent. Your prompts, datasets and annotations can stay where they are while you run the pilot.
Does it work with my coding agent? traceroot instrument and traceroot skills install support Claude and Codex, and a generic mode works with other agents.
Do I need to give TraceRoot access to my repository? Only for the code investigation and pull requests. Tracing works without it, but the trace needs the commit and the agent needs repository access to read your code.