
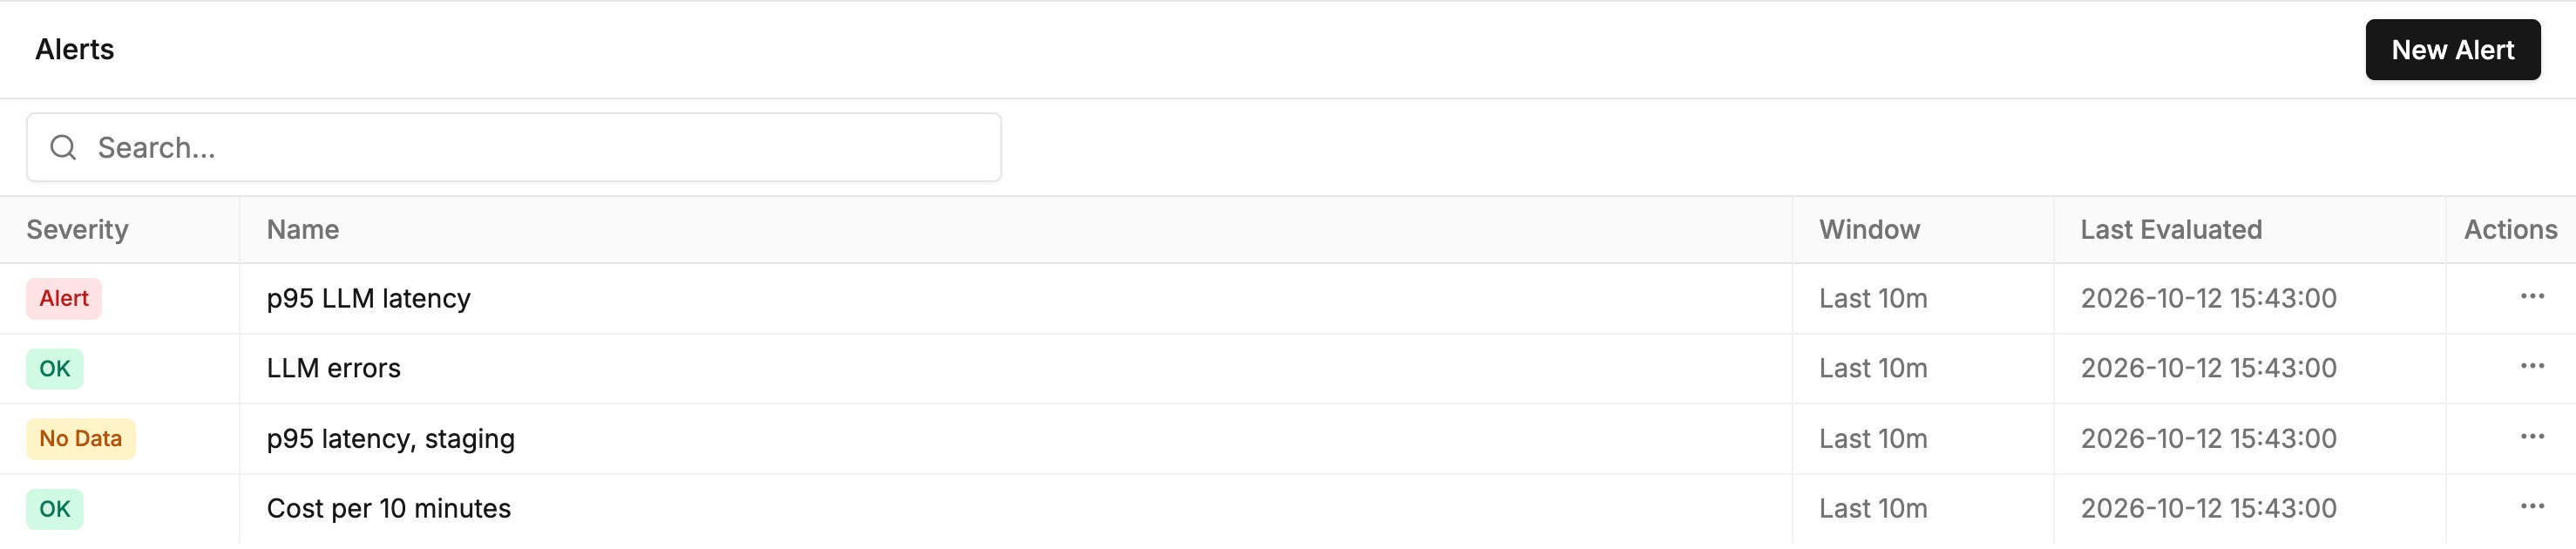
Alerts list: each rule's state, window and last evaluation
How alerts work
A rule reads as one sentence: aggregation of measure, over spans matching the filters, in the last window, compared to a threshold. For example,p95 of Latency over LLM spans in the last 10m, > 2000 ms.
Each evaluation reads OK, Alert or No Data, and only a change notifies:
- Entering Alert sends a message, and recovering to OK sends another.
- A rule that stays in Alert is quiet unless Renotify is on.
- To be told when traffic stops, alert on Count
<1. Count rules read0on an empty window, never No Data. - Other rules read No Data on an empty window and stay quiet, by default. Treat as zero compares
0to the threshold instead, and Notify when data stops sends a message for the gap.
How to create an alert
You need incoming traces, the Member role or higher, and Slack connected to the workspace (see Slack notifications). Open your project in TraceRoot Cloud, select Alerts from the left nav, then click New Alert.- Scope: click Add filter to limit which spans are measured, such as
Span kind is LLM. Leave it empty to measure every span. - Condition: pick the aggregation and measure, the operator and threshold, and the window. The threshold is in the measure’s unit, so “p95 latency over 2 seconds” is
2000. A rule has one threshold; for a warning and a critical level, create two alerts. - Notify: set When a window has no data and Renotify, and enter a Name. The defaults notify only on a breach and a recovery. Integration shows the Slack channel the alert posts to.
- Click Create Alert. The rule is active immediately, and its first result appears within a minute.
Create alerts with AI
Select Home from the left nav to open the AI agent, then describe the alert you want, or ask it to suggest one from your traces. For example:- “Alert me when p99 latency of LLM spans goes over 2 seconds”
- “Suggest a useful alert for this project based on my recent traces”
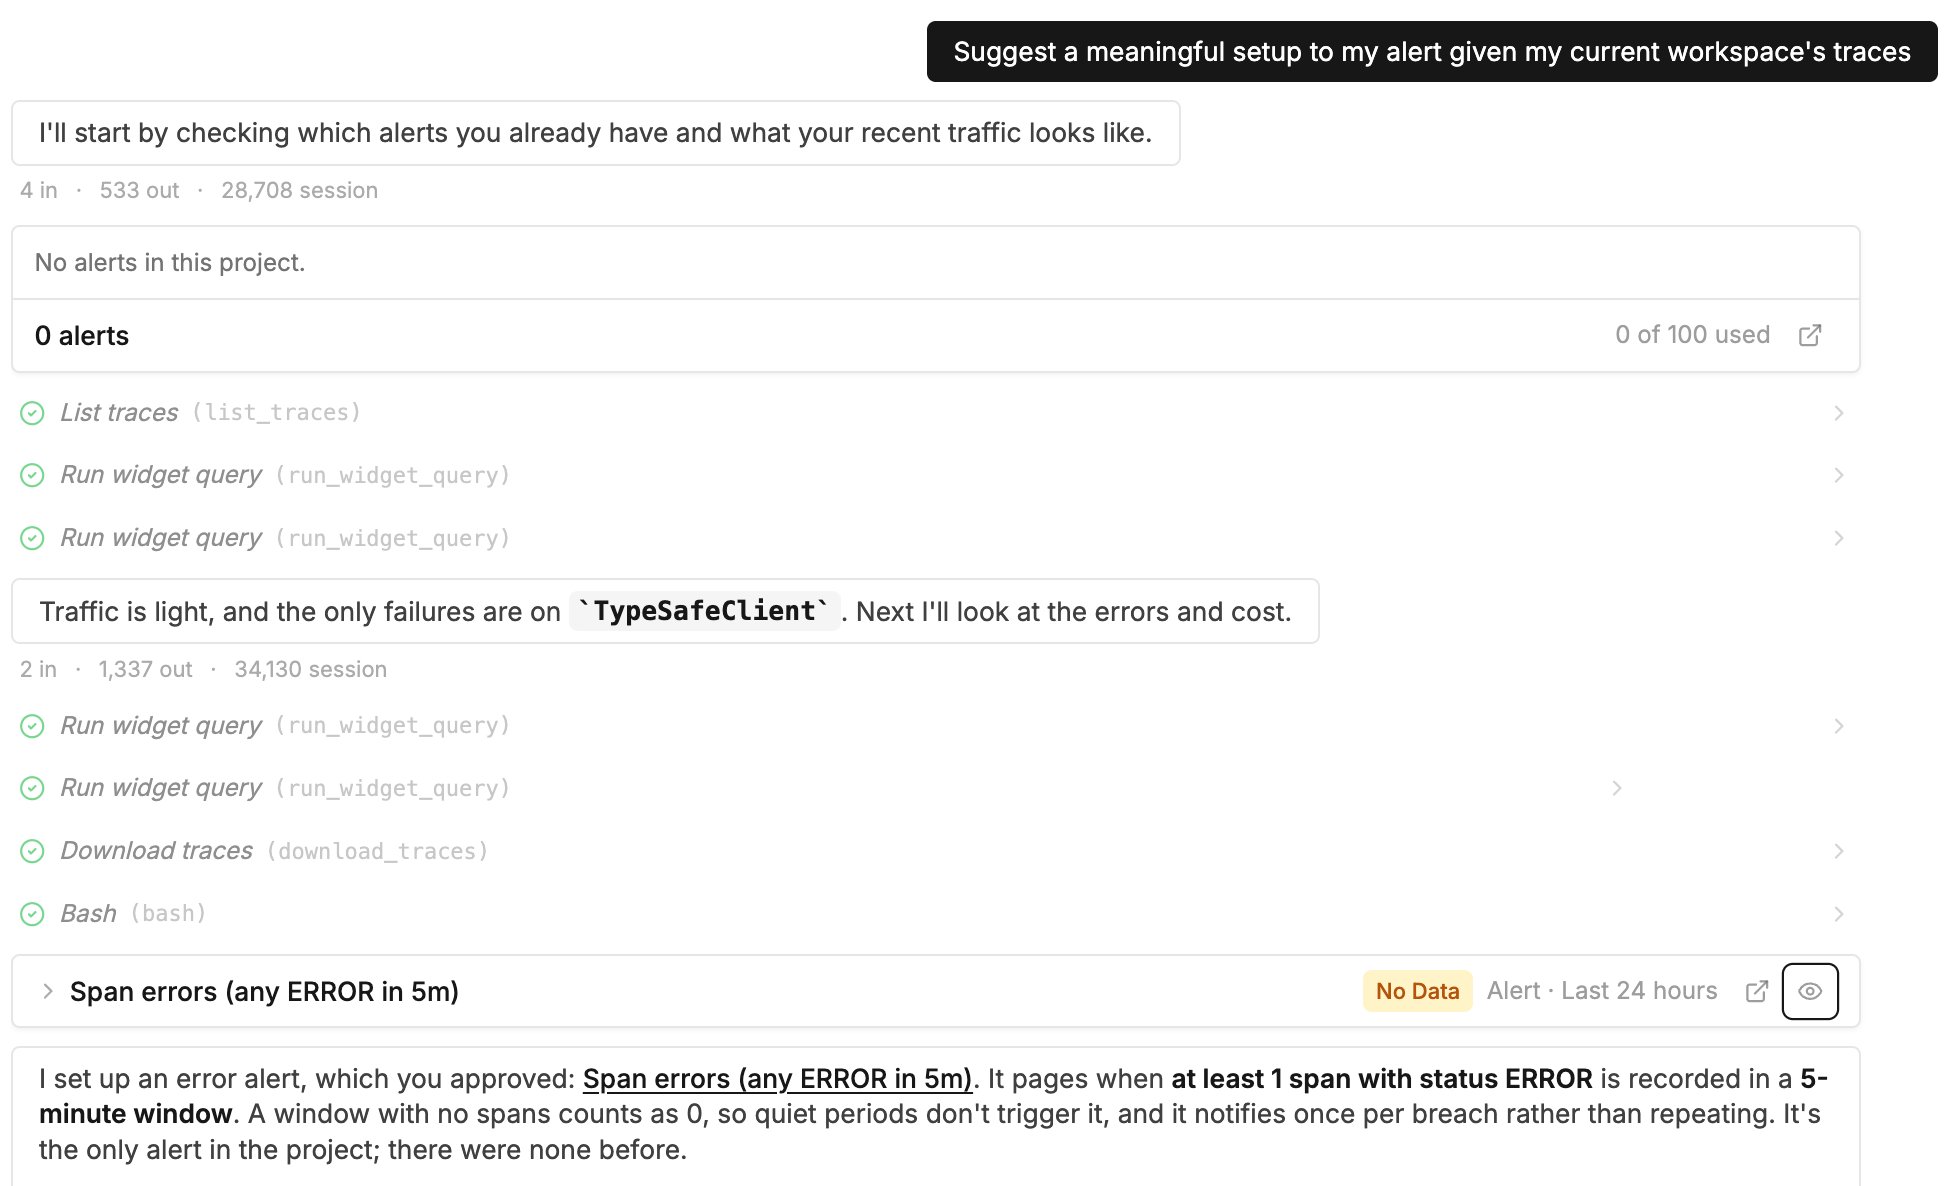
AI agent: an error alert suggested from recent traces, then approved in chat
traceroot alerts create) or the public API under /api/v1/public/alerts. Writes need a signed-in user; a project API key can only read.
Alert states
Each row in the Alerts list shows a badge. When a badge has a reason, such as why a notification was not delivered, click it to read it.- OK: the latest value is within the threshold.
- Alert: the latest value breaches the threshold.
- No Data: the latest window was empty, or the rule has not run yet.
- Failing: the last run failed. It retries on its normal schedule.
- Parked: TraceRoot stopped the rule because its settings cannot be evaluated. Fix the setting the badge names and save, or resume the rule.
- Paused: you stopped the rule. Nothing is evaluated or sent.
Manage alerts
Use the Actions menu on a row:- Pause stops evaluation and notifications. Resume starts the rule fresh.
- Edit opens the same form. Saving a change to the rule starts it fresh; a rename or a renotify change does not.
- Delete removes the rule permanently. Type the alert’s name to confirm.
Slack notifications
Slack is connected once per TraceRoot workspace, and every project in it posts alerts to that channel. Detector notifications use the same connection.- As a workspace admin, open Settings → Integrations.
- Click Connect and complete the authorization in Slack.
- Pick the channel TraceRoot should post to.
[ALERT] p95 latency, then states the value, threshold, window and filters in one sentence. View alert opens the rule, and a breach also links View traces for the evaluated window.
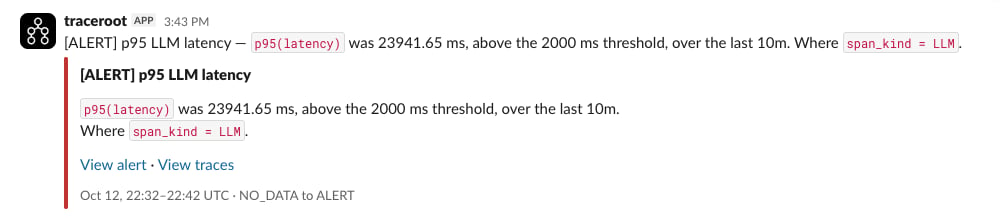
Slack message: a breach with its value, threshold, window and links
Next steps
Rule Reference
Every measure, unit, aggregation, filter and state.
Detector Notifications
Email and Slack digests for new and reopened detector signals.