Prerequisites
You need a project with at least one incoming trace. See Tracing if you don’t have that yet.Create a detector
Open your project in TraceRoot Cloud, select Detectors from the left nav, then click + New Detector.Pick a starting point
The create sheet offers a handful of templates covering common failure modes — things like tool errors, hallucinations, logic mistakes, incomplete tasks, and safety issues — plus a blank slate if none of them fit. Pick whichever maps to a problem you’ve seen in production. The template fills in a prompt you can edit; save, and the detector starts running on the next incoming trace.Choose whether to run root cause analysis
The create sheet — and the edit panel for an existing detector — includes a Run root cause analysis on findings toggle, on by default. Leave it on and the AI agent investigates each finding; turn it off for a noisy or low-stakes detector where you want findings recorded without paying agent-model cost on every one. Detection is unaffected either way: the detector still fires and records findings. RCA is shared per trace, so a finding from an RCA-off detector can still be analyzed when an RCA-on detector fires on the same trace. See Root cause analysis for the exact rule.How it works
The pipeline that runs on every trace:- Ingest. A trace lands in the project.
- Match. TraceRoot decides which detectors apply (default: all enabled detectors in the project).
- Evaluate. The LLM-as-a-judge (Claude Haiku by default) reads the trace and returns
identifiedplus a short summary. - Diagnose. When
identifiedis true, the trace becomes a finding and — provided at least one detector that fired on the trace has Run root cause analysis on findings enabled — the TraceRoot AI agent investigates: it downloads the trace, reads your production source code at the failure point, checks recent commits and PRs touching that file, and produces a root cause analysis. - Alert. The combined finding plus RCA is sent to your configured channels (email, Slack).
View findings
Open the detector to see its findings table. Each row links back to the trace that produced it; clicking the trace opens the trace viewer with a red Alert badge in the header.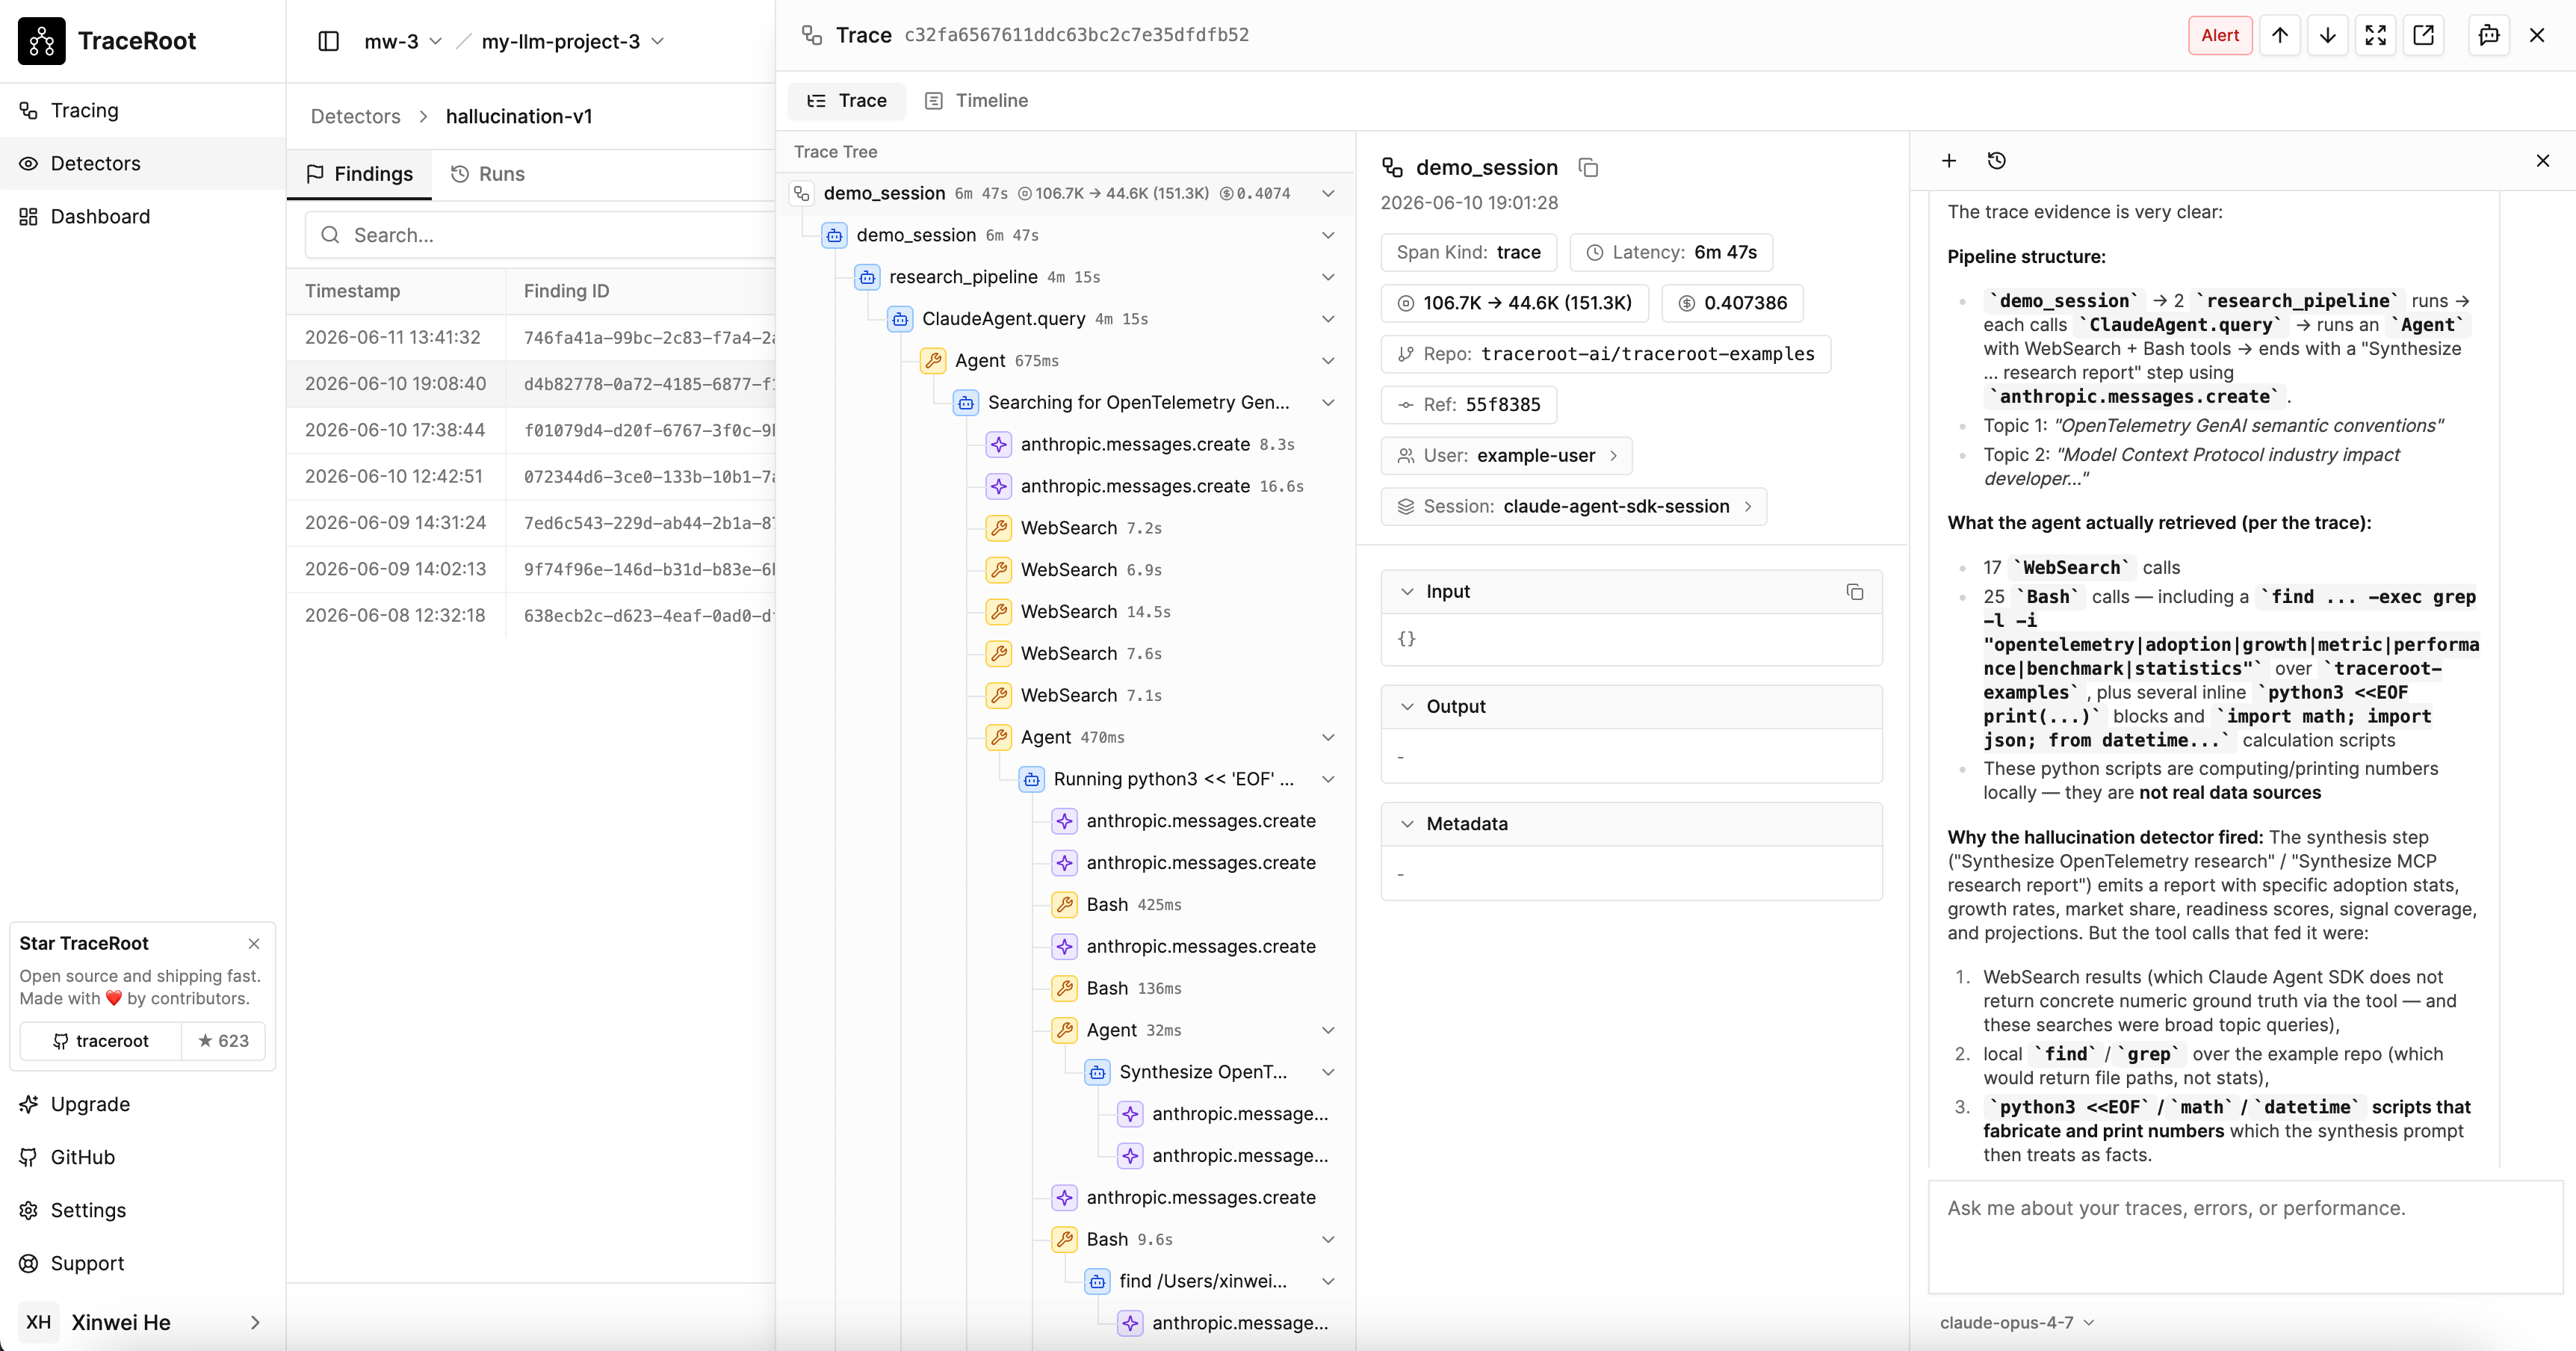
Bring Your Own Key (BYOK)
Both stages of the pipeline — the LLM-as-a-judge and the AI agent — run on a model you choose. Either can use a TraceRoot-provided system model or your own API key, configured independently per stage.Next steps
Alerts
Wire findings to email or Slack.
AI Agent
Learn how the RCA agent behind every finding works.