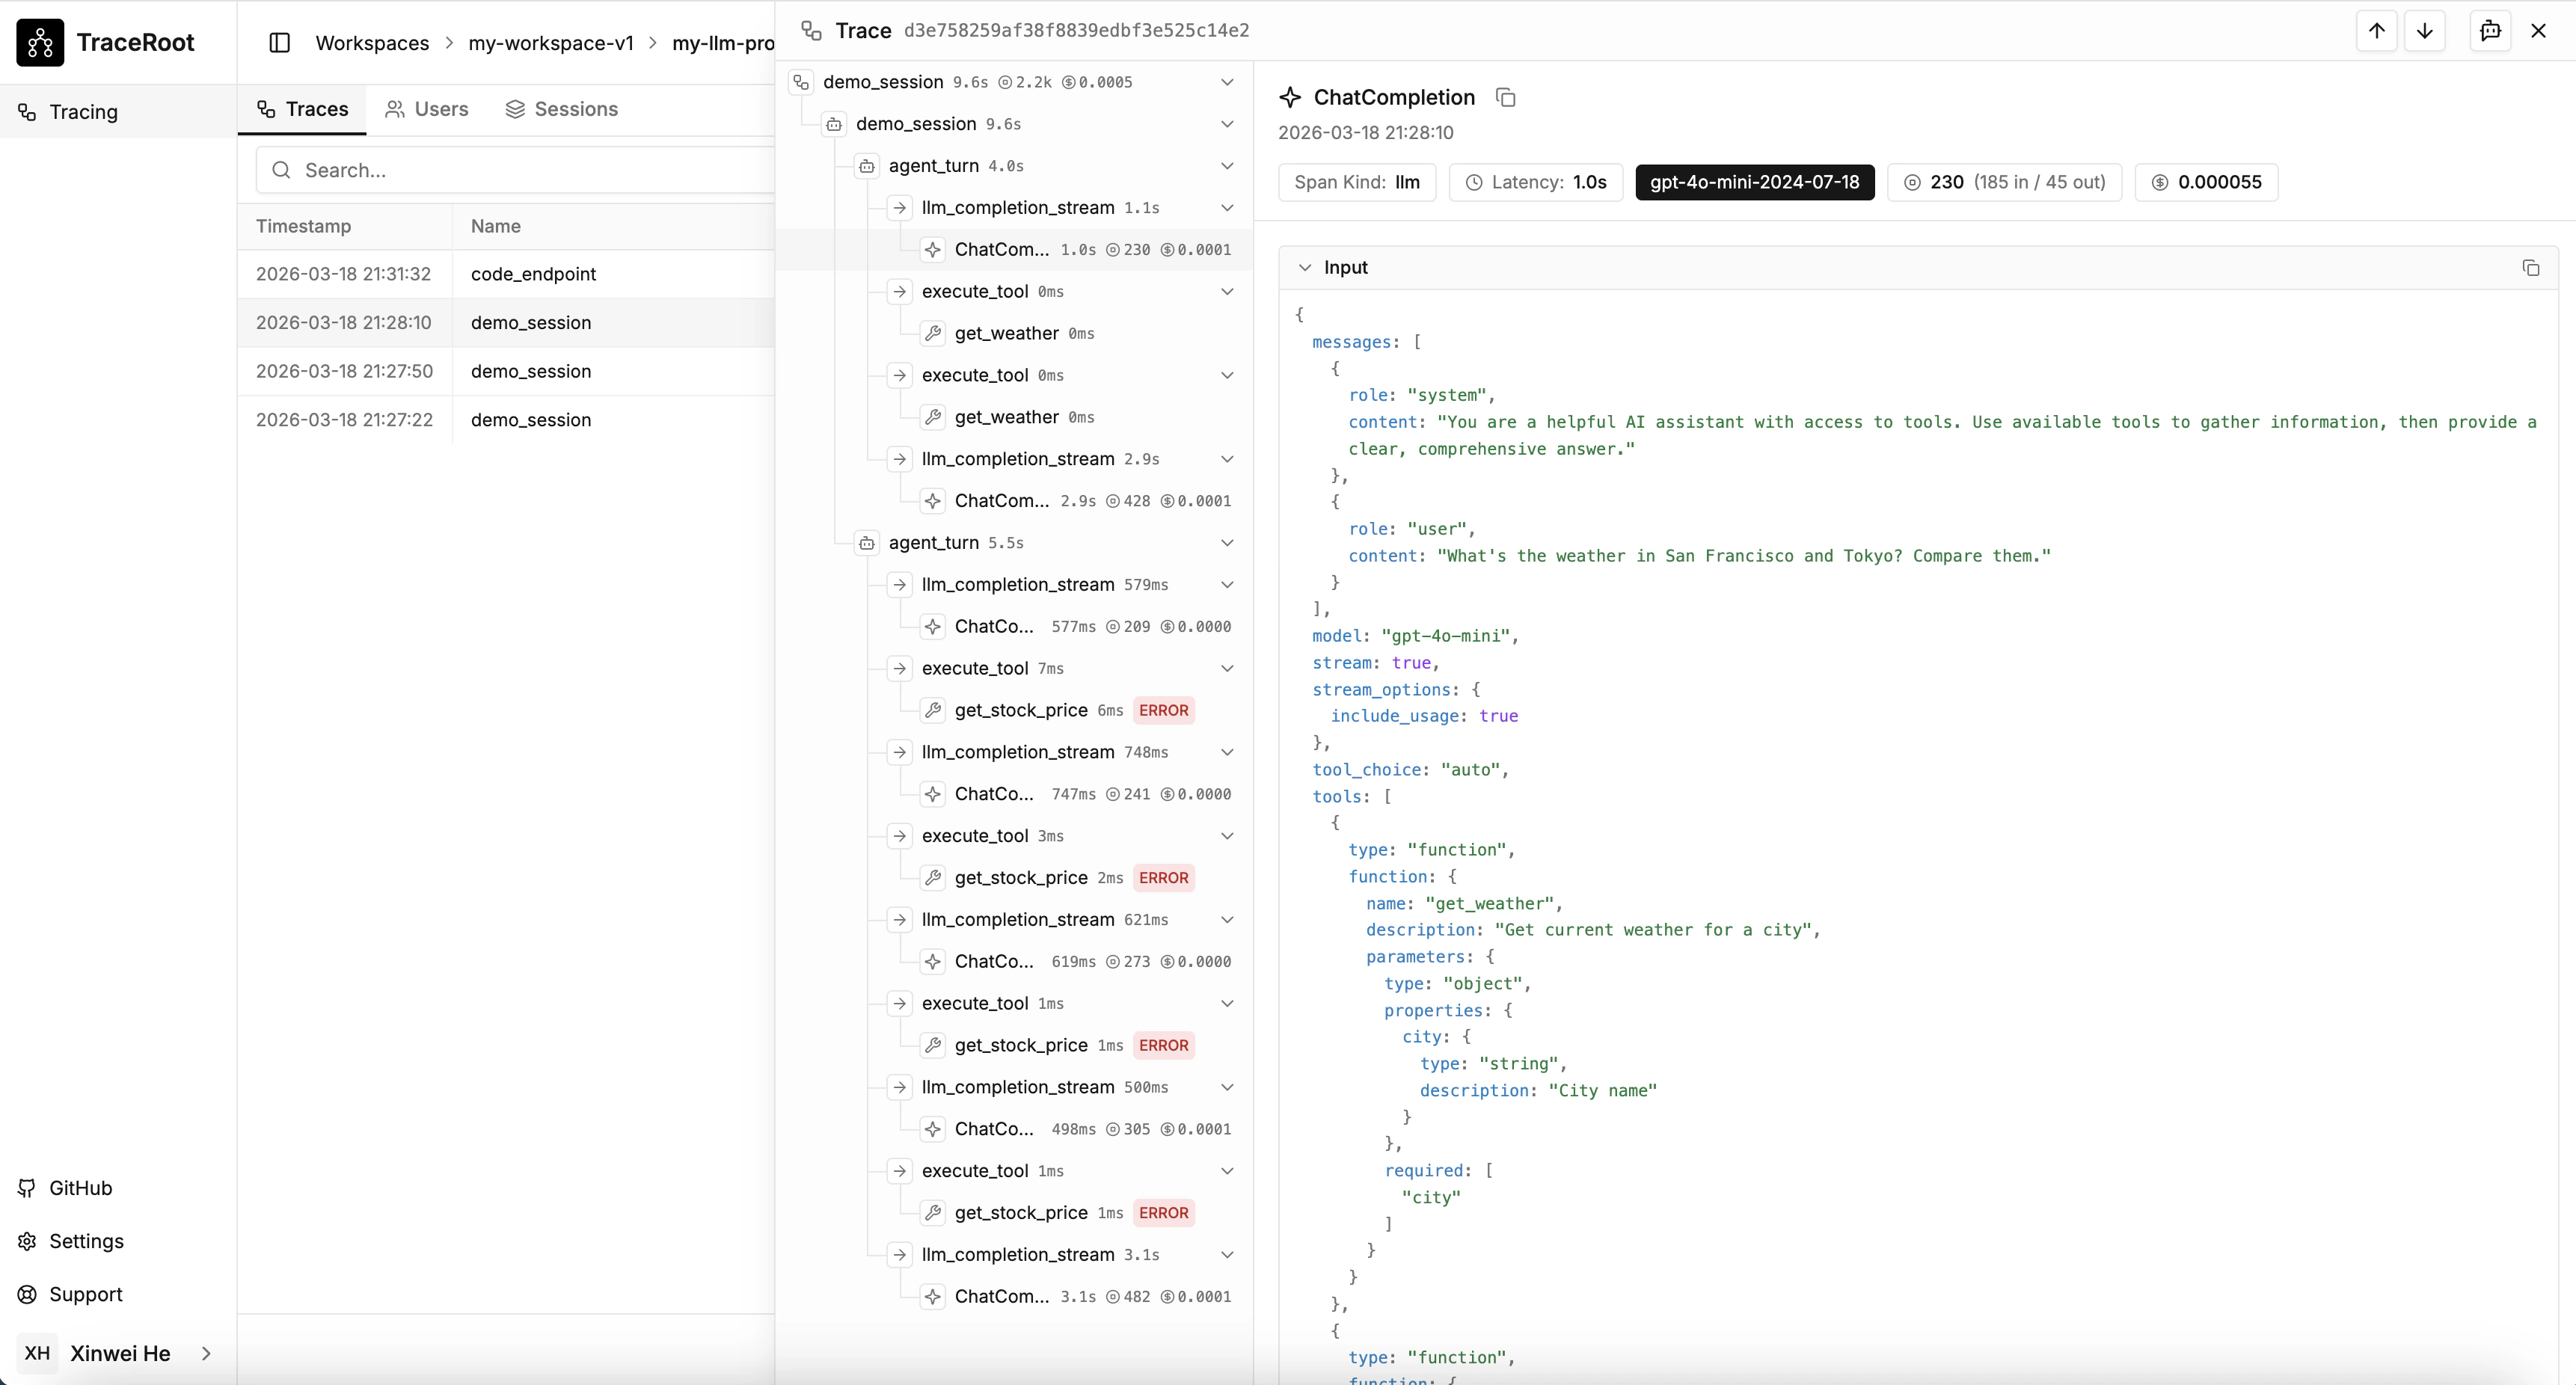
- Full span hierarchy — see exactly how your agent executes, call by call
- Token usage and cost — per LLM call and aggregated per trace
- Source code correlation — every span links back to the file and line that produced it
Where to start
Get Started
Instrument your agent and send your first trace in minutes.
Features
Attach users, sessions, tags, metadata, and more to your traces.