
traceroot does not auto-instrument Exa. You trace the search with
observe and report its cost yourself, and traceroot stores the cost you report. See Tool and API calls for how reported costs add up.Install
- Python
- TypeScript
traceroot 0.5.0 or later, or @traceroot-ai/traceroot 0.7.0 or later.
Set up
Initialize traceroot once at startup. No integration flag is needed: theobserve wrapper in the next step traces the search.
- Python
- TypeScript
Usage
Exa returns the dollar cost of each request incostDollars. To record it:
- Wrap the search in a function traced as a tool span (
type="tool"). - Read
costDollars.totalfrom the response. - Report it with
update_current_span(cost=...)(updateCurrentSpanin TypeScript) while that span is open.
- Python
- TypeScript
web_search from your agent like any other function. Its span nests under the span that called it, and its cost adds to that trace’s total.
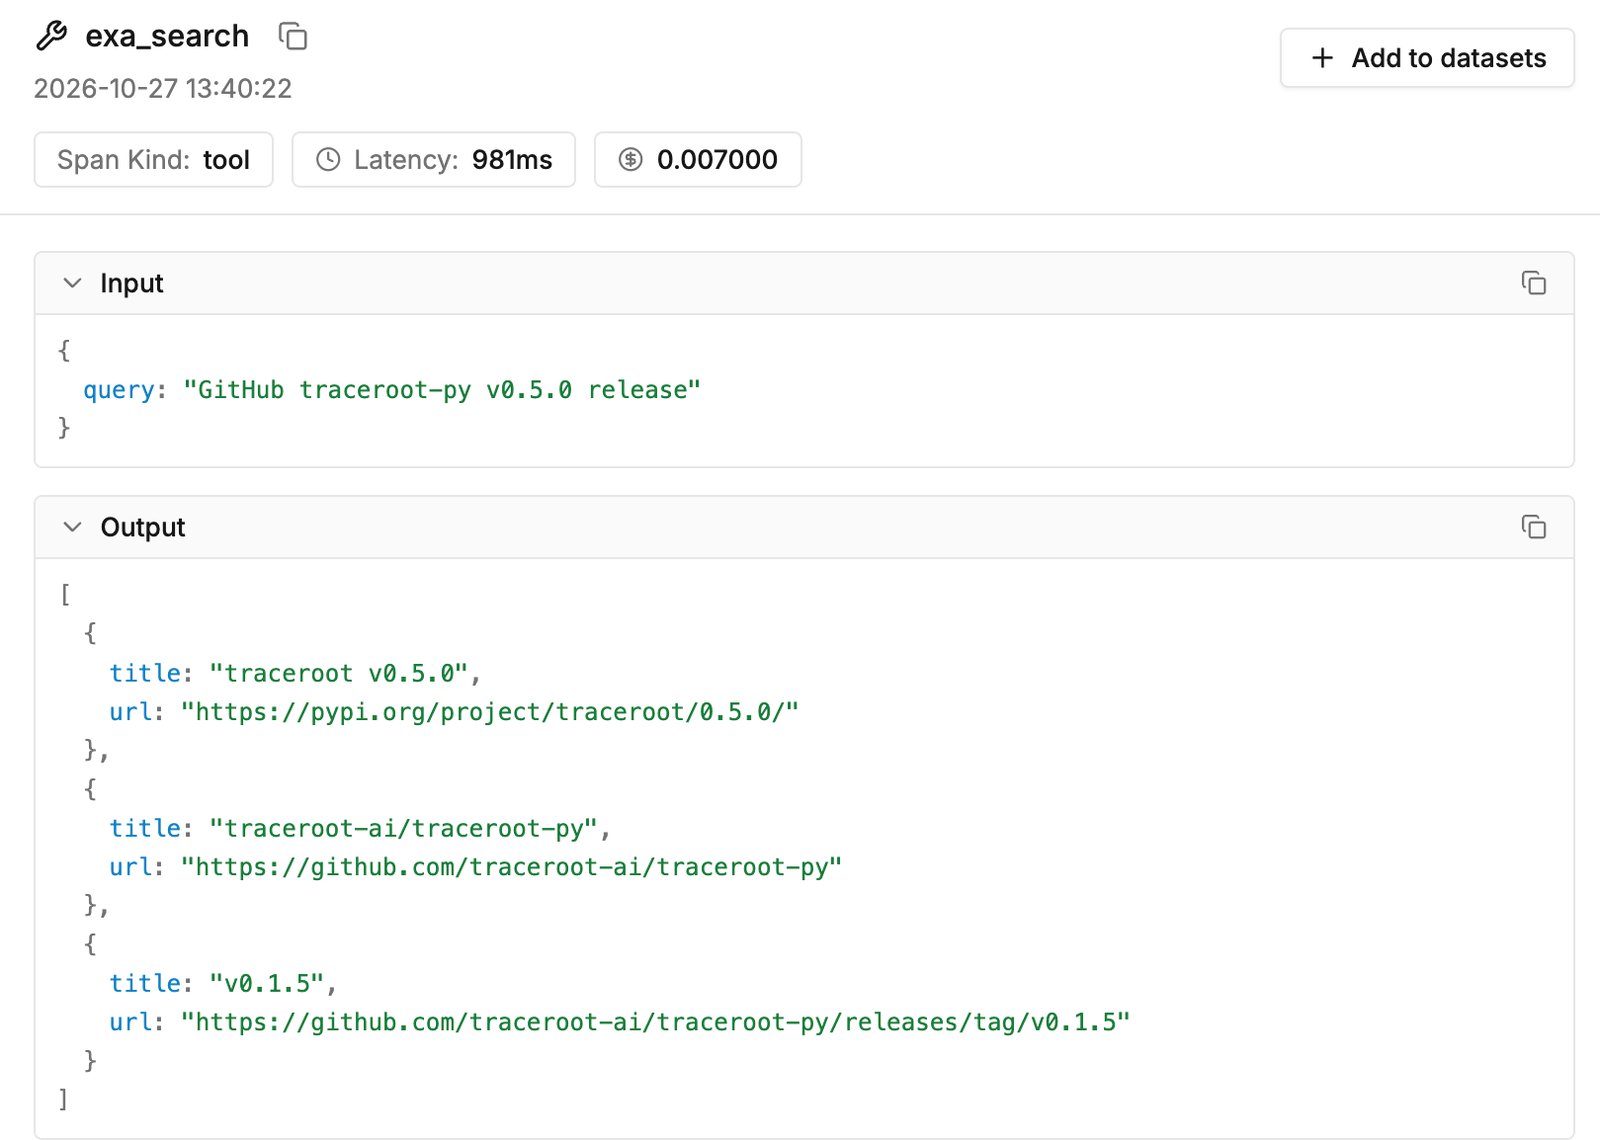
The tool span carries the price the search API returned
Verify
Run your code and confirm the trace arrives:- In the traceroot UI: Navigate to Tracing > Traces in traceroot Cloud. You should see an
exa_searchspan, at the root or under your agent’s span. Open it to see its cost; the trace’s total cost includes it. - Via the CLI: Run
traceroot traces listto inspect your recent traces from the terminal.
What gets captured
Limitations
- A response without
costDollarsrecords no cost on the span.
Next steps
Python SDK Reference
Explore the full Python SDK reference and instrumentation options.
Price in the response
Report the price a provider returns with each request