The TraceRoot agent: ask your traces what changed
The agent in the TraceRoot app reads your traces and your code at the production commit, and comes back with a change instead of a chart.
 Xinwei HePublished
 You can see the change in a chart. You have to read the traces to fix it.
Latency got worse at some point this afternoon. You know that from the chart. You do not know which step, and you are not going to open 300 traces to find out.
The chart tells you something changed. The traces contain the answer. Nobody has time to read them one by one, and the dashboard filters get you to a list, not to a cause.
The agent inside the TraceRoot app takes the question instead:
Look at the traces in the past three hours and suggest code changes to reduce latency.
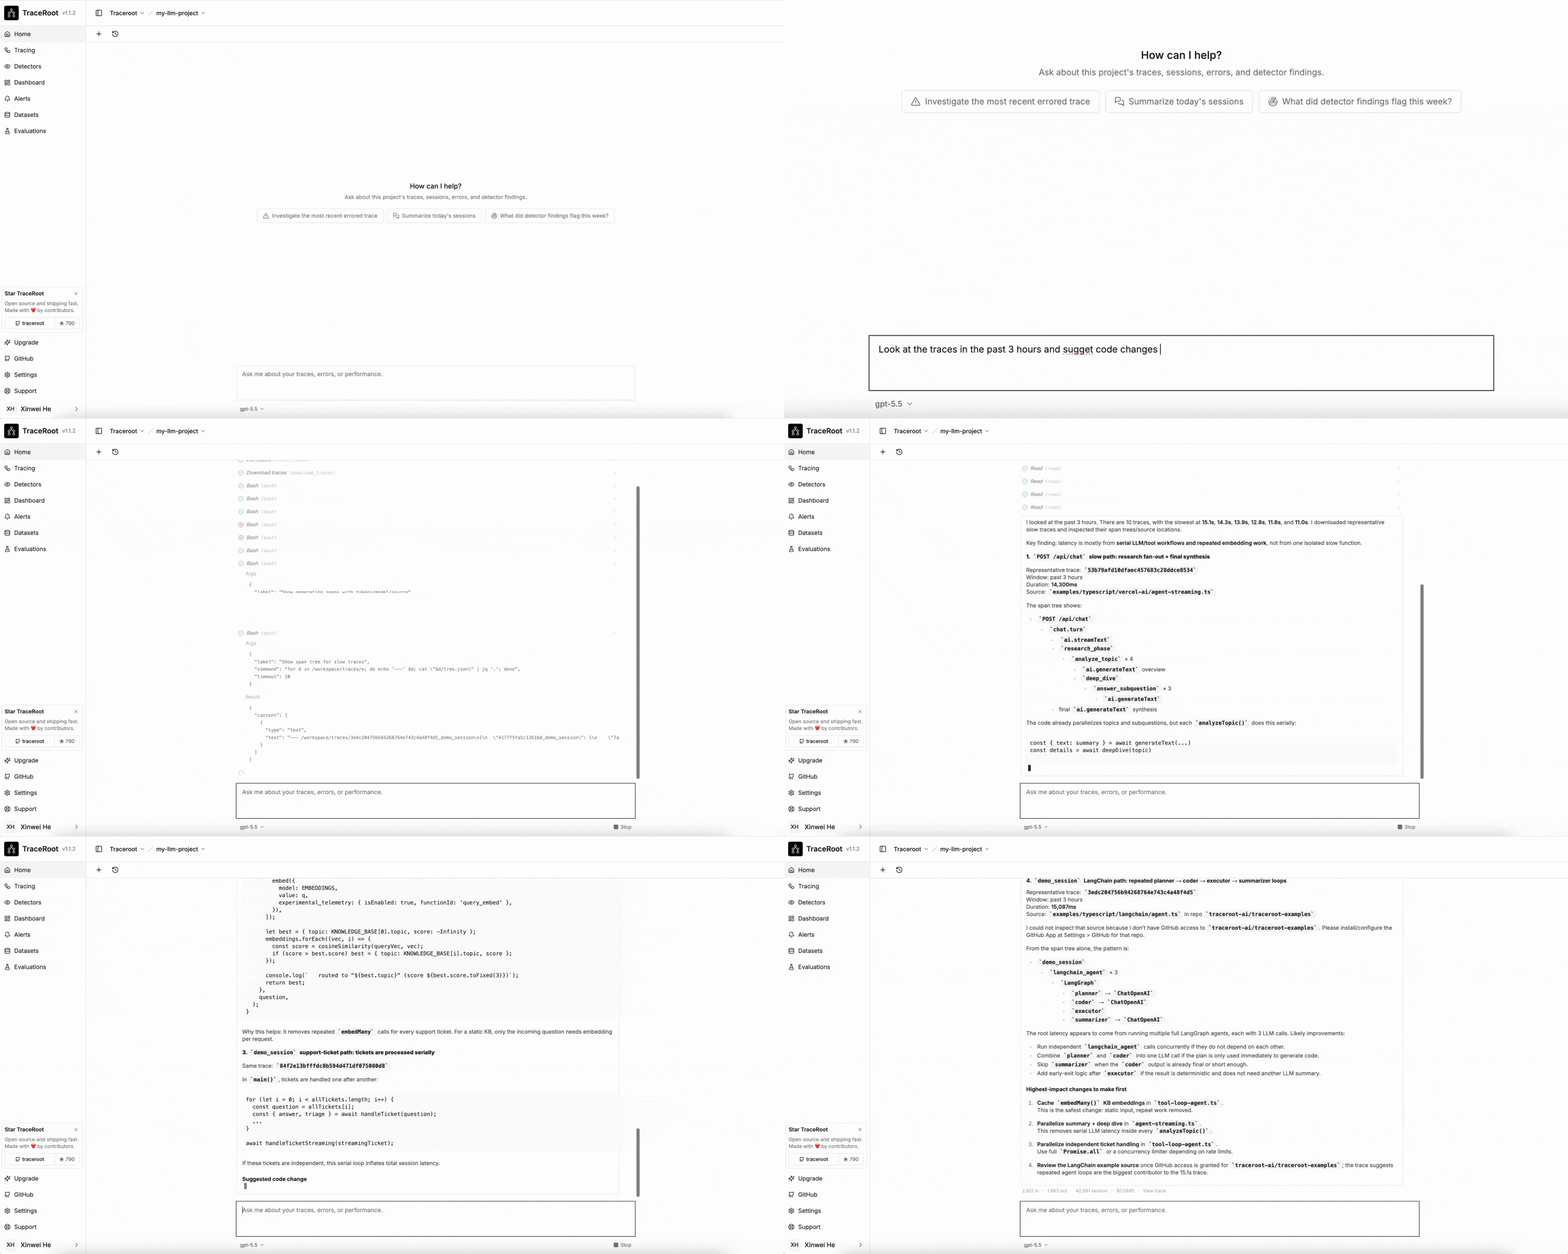
This post is the step-by-step of what it does with that sentence. A suggested change is only useful if you can see how it got there. It runs on the same tool registry as the CLI, generated from one OpenAPI schema, so it reaches for the same operations you would run in a terminal.
Step 1: Ask it in plain words
The prompt is the question you would ask a colleague who had the afternoon free. A good one carries a time window ("the past three hours"), a symptom ("latency got worse") and what you want back ("suggest code changes"), all in plain English with no query syntax. Leave one out and the agent fills the gap itself, so it is worth asking which window it used before you read the answer.
Step 2: Which traces does it pick?
The agent works inside the project you are in. From the question, it derives a trace query: the time window, and any filter it can read off the symptom, such as status, a tool name, or a latency floor. It runs that query against the same trace store the trace list uses.
In this demo, list_traces requests up to twenty traces with start_after set to 2026-10-02T00:00:00Z and a duration_ms > 0 filter. It returns ten traces. The agent then selects four representative slow traces to download.
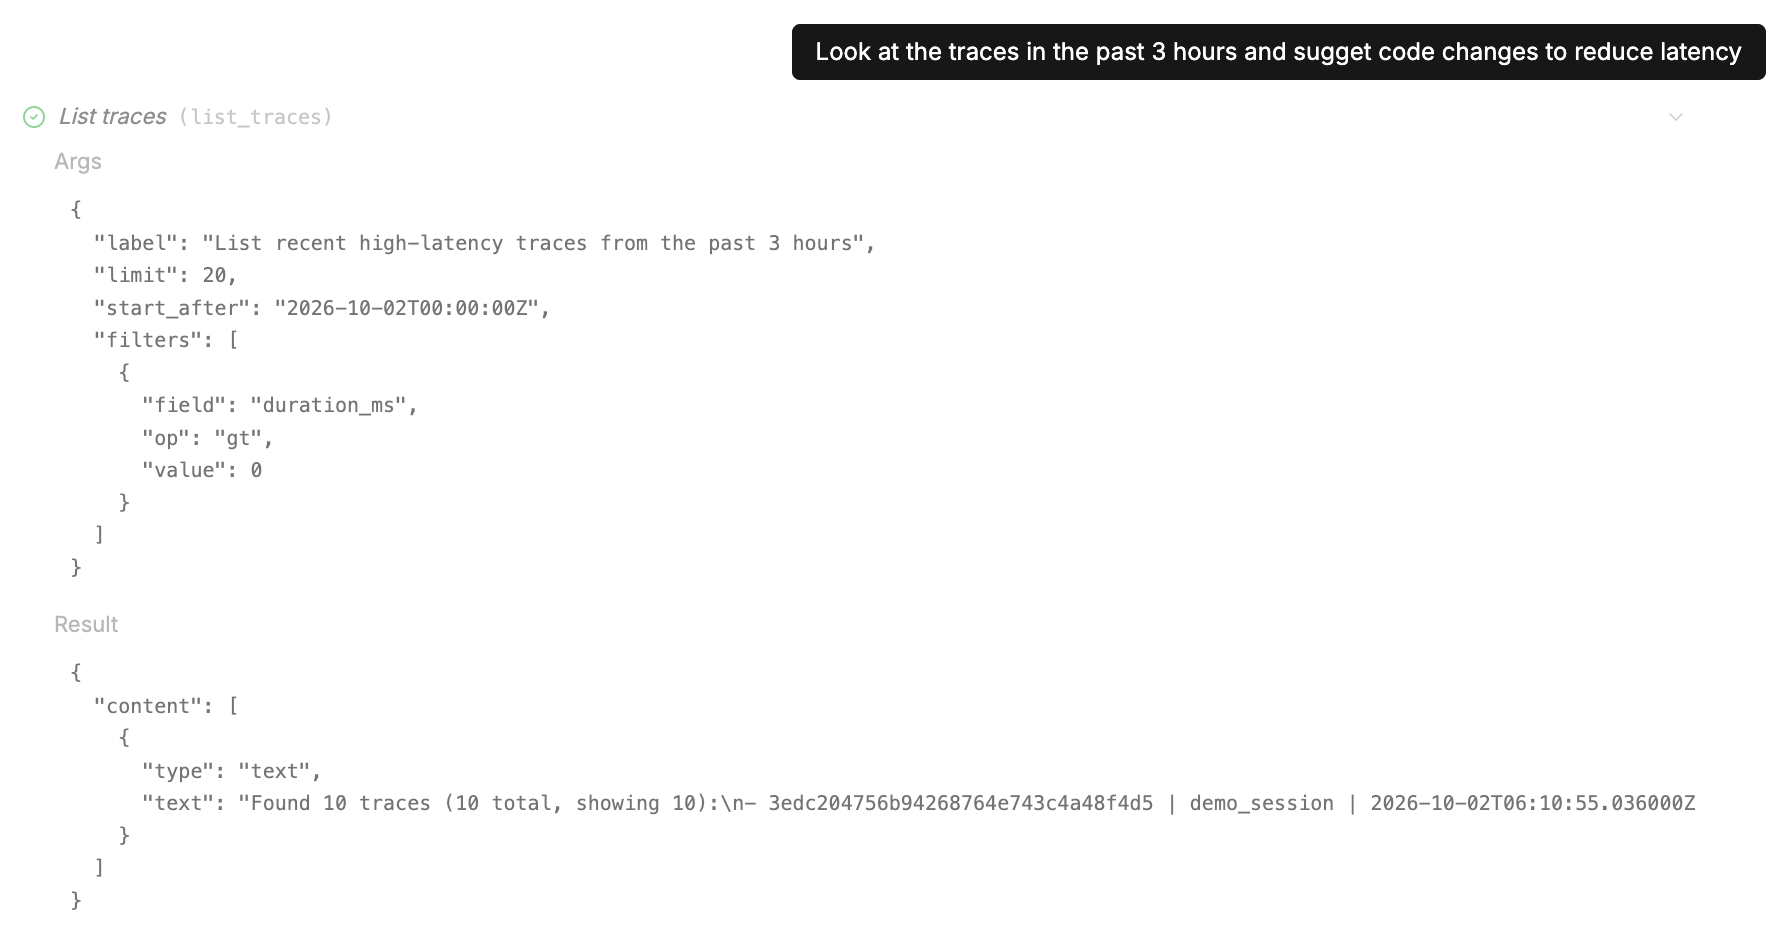
Ask it what it selected: how many traces, over which window, with which filters. Check the actual cutoff and returned timestamps, even when the tool's label says “past three hours.” If they do not match what you expected, refine the question before following the analysis.
Step 3: It pulls them into a sandbox as files
The agent does not page through traces in the UI. It downloads full traces into a sandbox in parallel, including span inputs, outputs, metadata and the Git context the SDK recorded. Each trace gets three files: trace.jsonl for trace metadata, tree.json for the span hierarchy, and spans.jsonl for the individual spans. This follows the same filesystem-first approach as the CLI's traces export.
The sandbox belongs to the conversation, so follow-up questions can reuse the downloaded traces and repository checkout.
Then it reads them with grep-style tooling. That is the design principle behind both the CLI and this agent: put the data on a filesystem and let a coding agent search it. In this run, download_traces fetches the four selected traces, and bash inspects their spans and Git metadata.
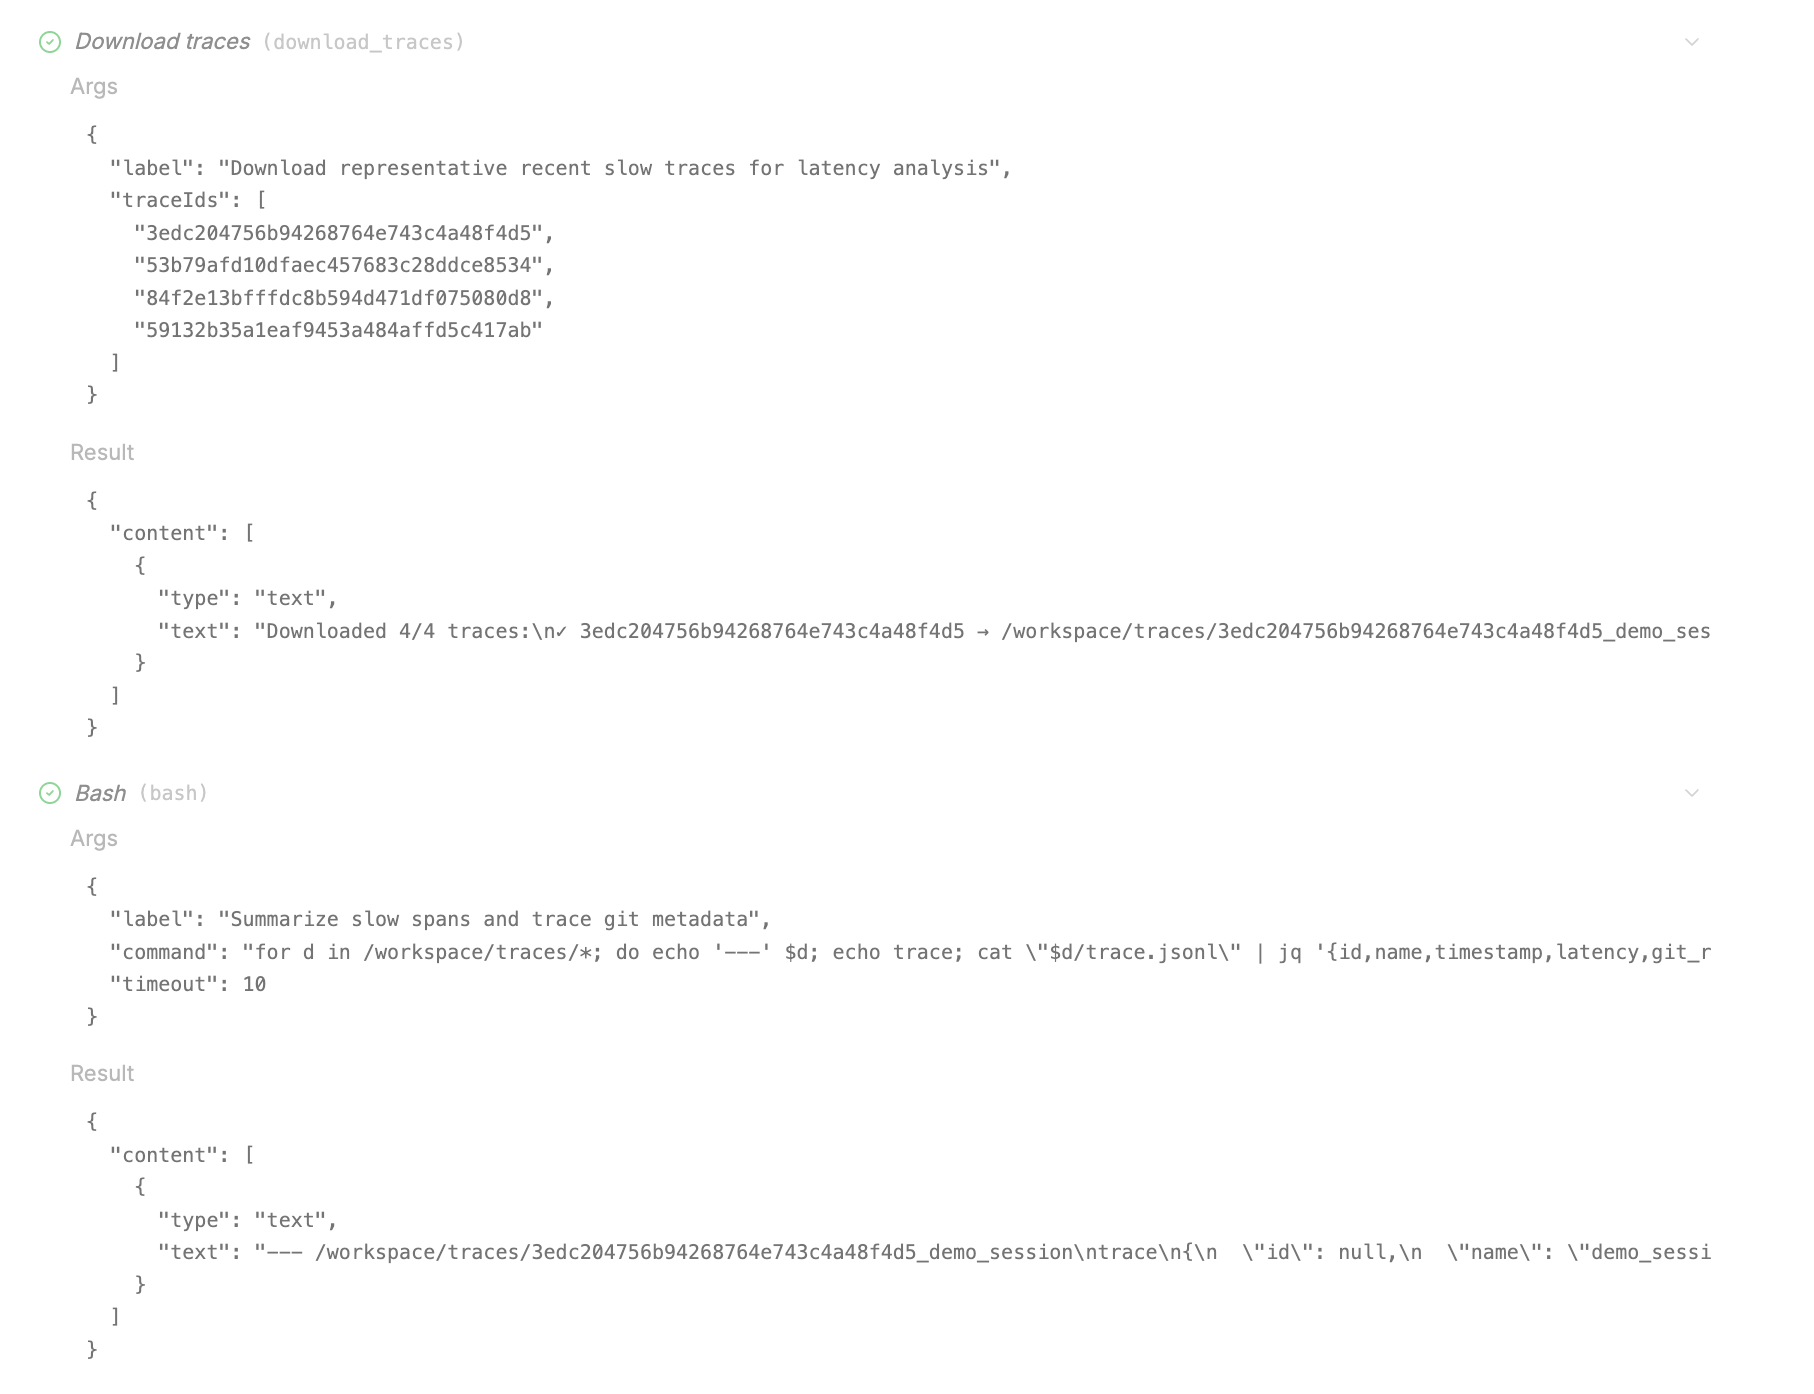
One of those traces leads to the POST /api/chat pipeline, with a duration of 14.3 seconds. The agent follows its span tree through ai.streamText, research_phase, and final ai.generateText synthesis. It now has a specific execution path to follow into the code.
Step 4: Which code does it read?
If the project has GitHub access, the agent clones the repo into the same sandbox. For investigations spanning multiple repositories, it can clone the accessible repositories in parallel.
The commit matters. When a trace carries a repository and Git reference, the agent checks out that ref and reads the code that produced the trace. In the demo, git_clone requests a specific ref for traceroot-ai/traceroot. Check that ref against the deploy you are investigating; today's main may contain different code.
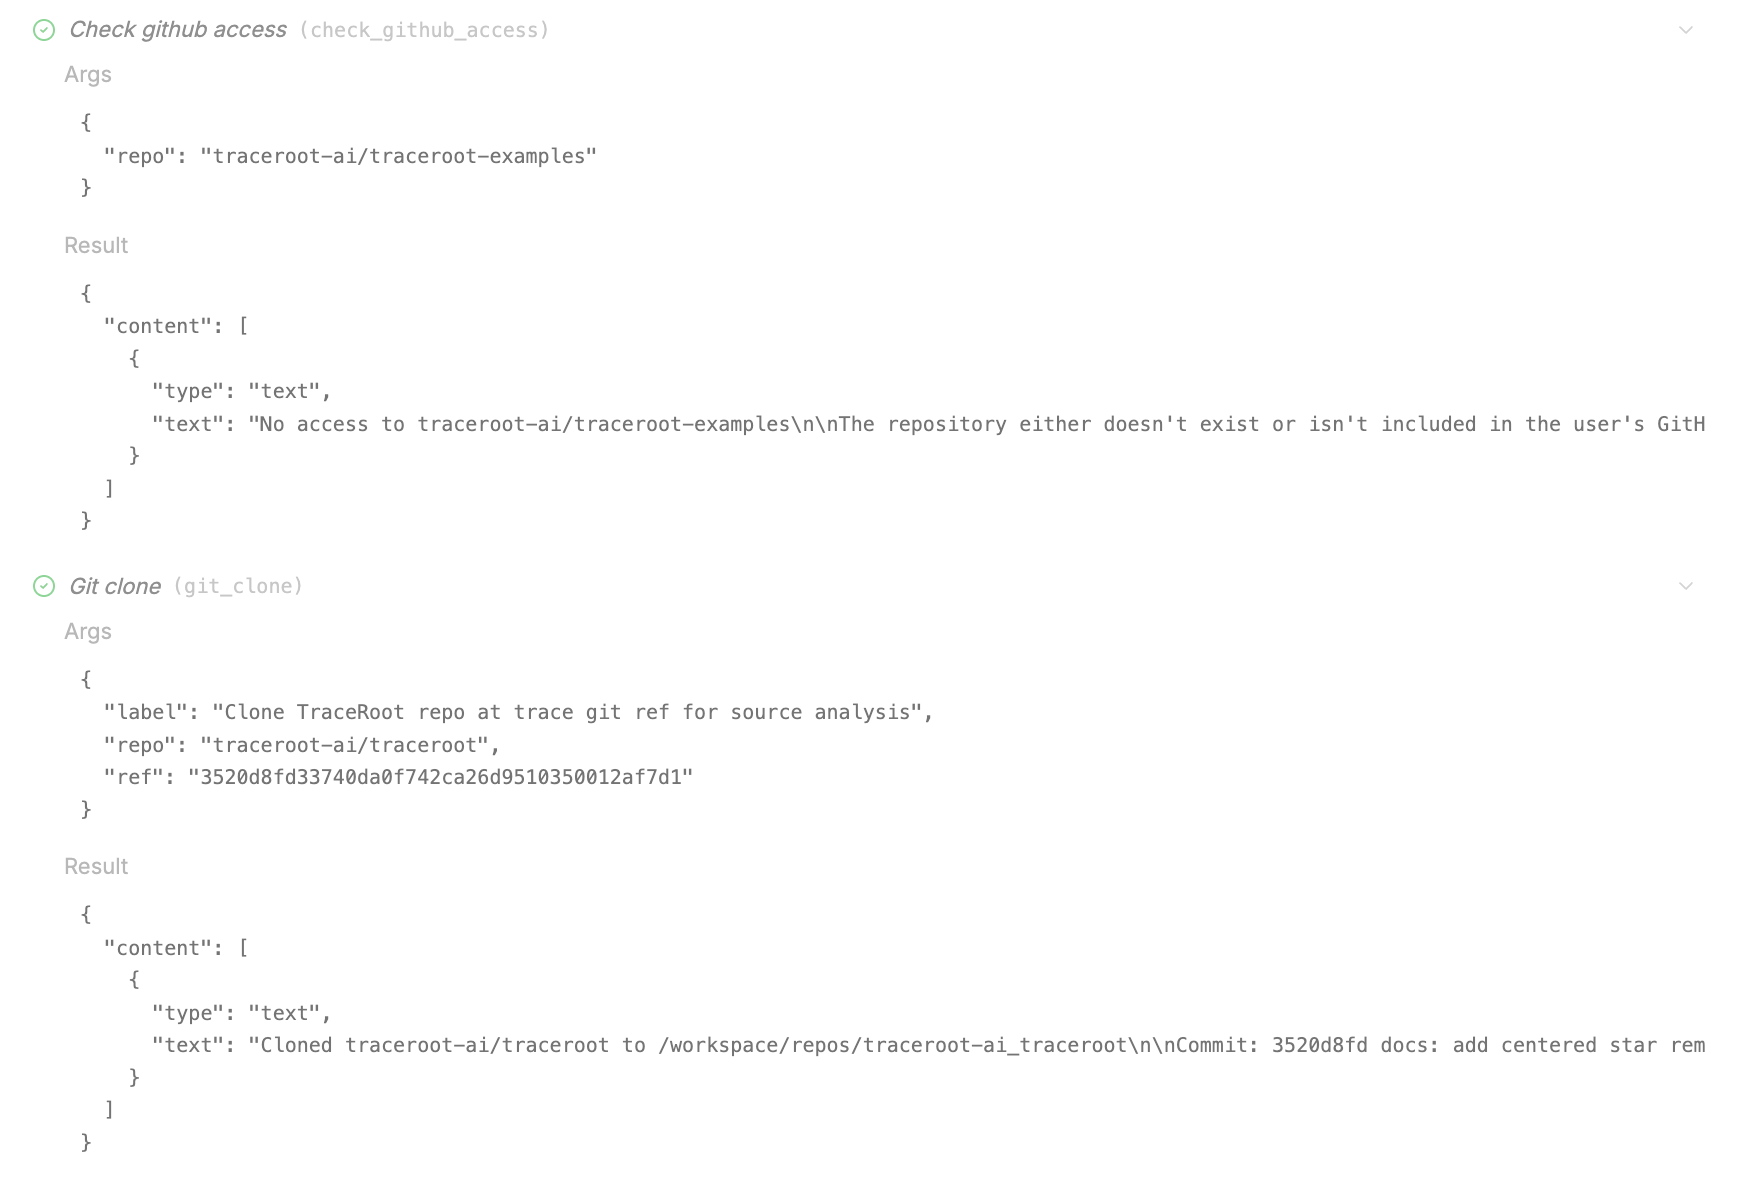
The same run shows what happens when access is missing. The agent cannot read traceroot-ai/traceroot-examples, so its analysis of that LangChain run is based on spans alone. Connecting the repository through the GitHub integration gives it the source needed to check those suggestions. If a trace has no Git reference, you also need to establish which revision ran before treating the checkout as evidence.
Step 5: How does a span map to a line?
For spans your own code creates, the SDK can record the file, line and function, alongside the repository and commit. The agent opens the call site in that checkout and reads what surrounds it: the retry policy, the timeout, the prompt that was assembled, or the loop the call sits inside.
In this demo, it reads examples/typescript/vercel-ai/agent-streaming.ts and compares the source with the chat trace. Topics and subquestions already run in parallel, but each analyzeTopic() awaits the overview from generateText() before starting deepDive(topic). The agent proposes running those two operations concurrently where their inputs are independent.
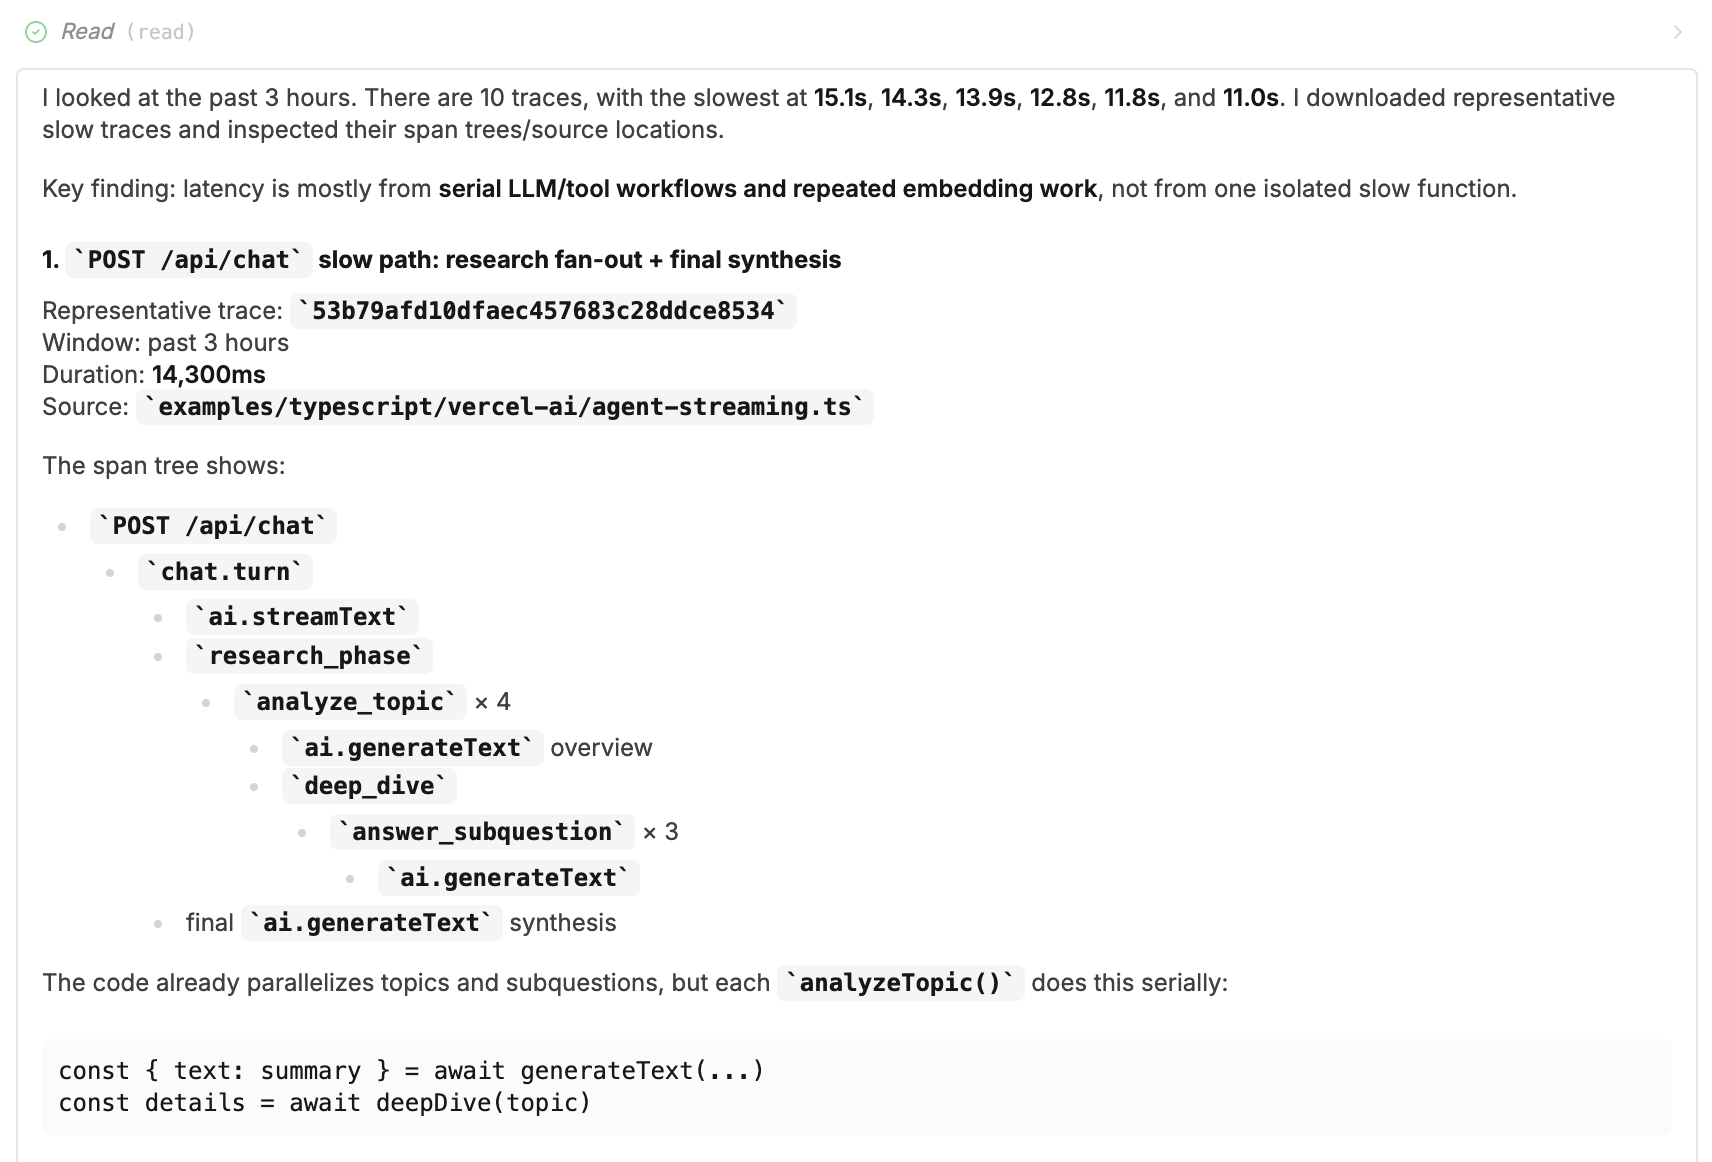
That is the step that separates an answer from a hint. The span tree shows where time went. The source shows where the next operation waits, and where a change could be made.
Step 6: It comes back with a change, not a chart
The result is analysis plus code suggestions: which step, what it found, what to change, with the trace IDs and file paths it used. You can take the suggestion into your own editor.
With GitHub connected, you can also ask the agent to implement a small fix and open a pull request. It edits the code in the sandbox, commits the change on a new branch, pushes it, and opens a PR for you to review. Review, test and merge it through your usual GitHub workflow.
Here, the agent prioritizes caching repeated knowledge-base embeddings in tool-loop-agent.ts, parallelizing summary and deep-dive work in agent-streaming.ts, and running independent ticket handling concurrently with rate limits in mind. It also calls out the LangChain source it could not inspect, so you can distinguish those hypotheses from the suggestions backed by code.
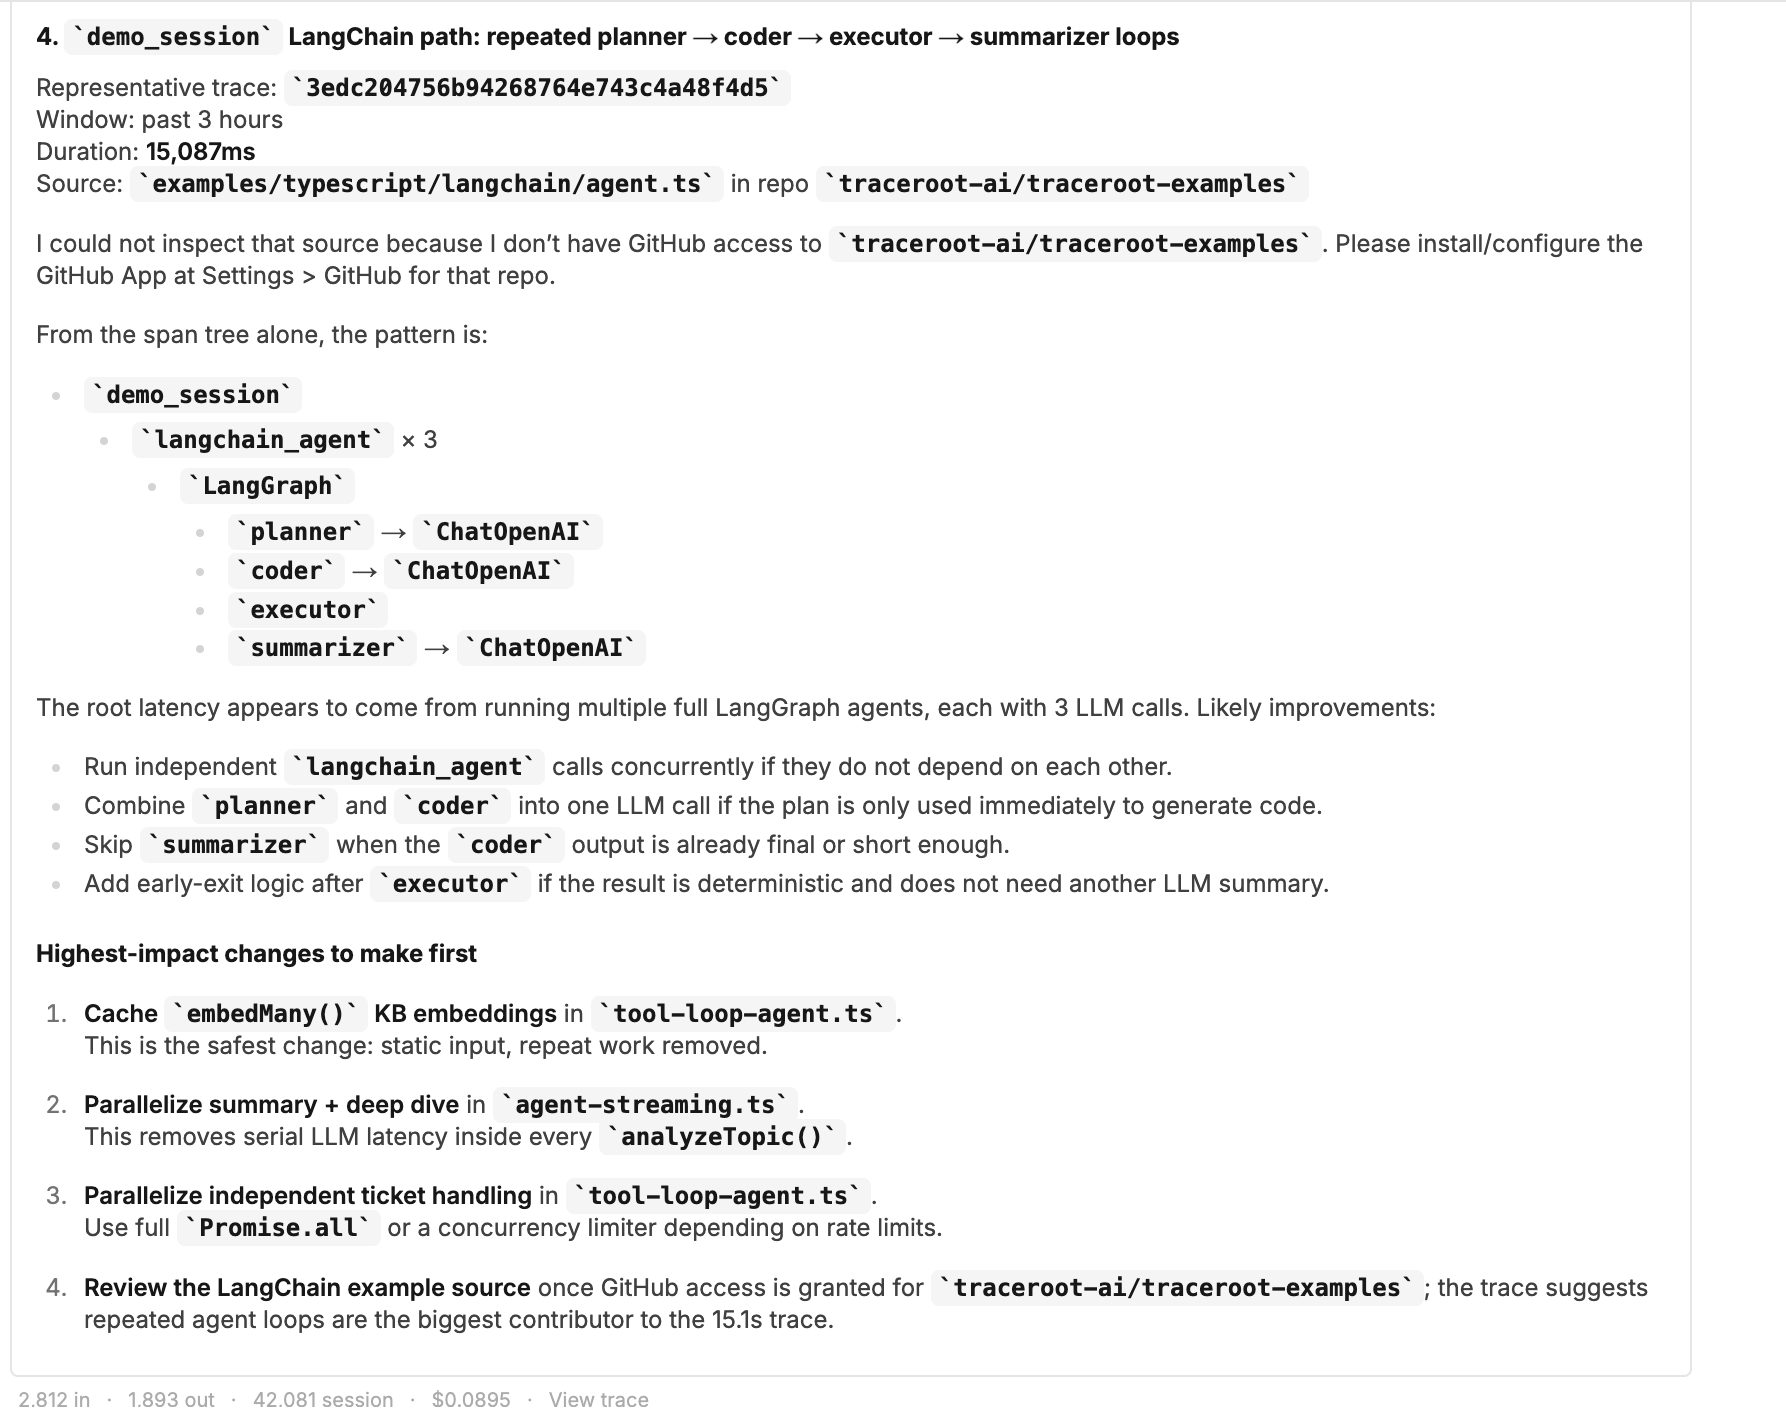
These are proposed changes, not measured improvements from a shipped fix. Before applying them, check that the concurrent operations are independent and that cached embeddings stay valid when the knowledge base changes.
Step 7: What to check before you trust it
It is a coding agent reading logs and code. It is good at that, and it can still be wrong, so the output is built to be checked in three places.
Check the selection: the count and window it reports match what you meant. Check the commit: the ref it checked out is the deploy you are investigating. Check the claim: the span it quotes is in the trace, and the code it cites is in that checkout. If all three hold, test the suggestion and run an offline eval before it ships. If one does not, ask again with a tighter question.
There is a fourth check: open View trace on the agent's own response. The agent traces itself, so you can inspect which tools it called and what came back.
Where this sits
The CLI brings trace data into your coding agent's terminal. The in-app agent starts the investigation inside TraceRoot, with the traces and a checkout of the code available in one sandbox. Both give the agent the context it needs to connect a slow span to the code behind it.
This walkthrough focuses on latency. The same trace analysis tools can help investigate errors, tool failures, and cost. The useful question is whichever one is holding up your next change.
So, what will your agent find?
In this run, one question led to four downloaded traces, a repository checkout, and specific suggestions for reducing repeated and serial work. That gives you a concrete starting point: a trace to inspect, a file to open, and a change to test.
Point it at your own afternoon. Ask what changed in the last three hours and see what comes back, then tell us where it got it wrong. Open an issue on GitHub or find us on Discord.
A chart shows you the change. The traces and the code, read together, show you the fix.