Best AI Observability Tools in 2026: 6 Platforms Compared
Compare the 6 best AI observability tools in 2026: traceroot, Langfuse, LangSmith, Braintrust, Arize Phoenix and Opik, on tracing, evals and openness.
 Xinwei HePublished 16 min read
On this page
Your agent returned a 200. Every span in the trace is green. The answer was still wrong, and the first person to notice was a customer.
That is the gap AI observability tools are built to close. They record what an agent did on each request and score whether the result was any good. That record is also where improving an agent starts.
In this guide, we compare six AI observability tools on what they capture, how they evaluate it, how far they go toward improving the agent, how open they are, and what they cost to start:
- traceroot: Open-source AI agent observability and improvement platform: tracing, evaluation and monitoring, plus Signals that group production failures and trace them back to your code.
- Langfuse: Open-source AI engineering platform for tracing and evals.
- LangSmith: LangChain's commercial platform for agent observability and evaluation.
- Braintrust: Commercial observability and evaluation platform with a built-in agent, Loop.
- Arize Phoenix: Arize's open-source platform for tracing, experimentation and evaluation.
- Opik: Comet's open-source LLM observability and evaluation platform.
What is AI observability?
AI observability is the practice of seeing what happens inside an LLM application or agent while it works, and judging whether the outcome was right. An agent does not give one response to one request. It plans, calls tools, reads documents and hands work to other agents, and any of those steps can go wrong without raising an error.
Four parts make up the picture:
Traces show the full path of one request. Each step inside it (an LLM call, a tool call, a retrieval) is a span, and a session groups the traces of one conversation.
Metrics put numbers on behavior: latency, token use, cost per request and error rate.
Evaluations check quality. A scorer or an LLM judge reads the output and decides whether it was accurate, complete and safe.
Analysis is the newest part. Once a tool can tell a bad run from a good one, it can group similar failures, look for the cause and suggest a change.
Traditional monitoring was built for deterministic software, where the same input gives the same output and a failure throws an exception. Agents are non-deterministic, and their worst failures look like successes.
What features do you need in an AI observability tool?
Every tool in this guide clears the minimum bar:
- Tracing: every LLM call and tool call, with inputs, outputs, latency and tokens.
- Cost tracking: spend per request, model and user.
- OpenTelemetry ingestion: so you are not tied to one vendor's SDK and can send the same traces to two tools while you decide.
- Evaluation on production traffic: an LLM judge that scores live traces, not only test runs.
The best go further:
- Failures grouped into problems. A thousand low scores are noise. One tracked problem with a thousand traces behind it is something a team can own.
- A link back to your code. A root cause is far more useful when it names the file and the commit than when it stops at the trace.
- An agent that does the investigation. Several tools now ship an agent that reads the traces, and sometimes the repository, and proposes a fix.
- A way to verify the fix. Datasets and evaluations let you rerun the failing cases before you merge.
One more thing to check early is how open the platform is. Some tools publish the whole platform and let you run it yourself. Others publish only their SDKs.
The 6 best AI observability tools in 2026
1. traceroot
traceroot is an open-source platform for observing and improving AI agents in production. It has the full observability stack (tracing, cost tracking, sessions, dashboards, alerts and evaluations) and builds an improvement loop on top of it. It is built for teams that already have an agent in front of users and want each production failure to make the next release better. The loop has four steps: trace, detect, Signals, verify.
Tracing starts with the Python or TypeScript SDK, which is built on OpenTelemetry and integrates with 15 agent frameworks. Along with inputs, outputs, tokens and cost, traceroot records git context: the repository and commit on every trace, and the source file, line and function on every instrumented span. That gives you full GitHub context on every trace.
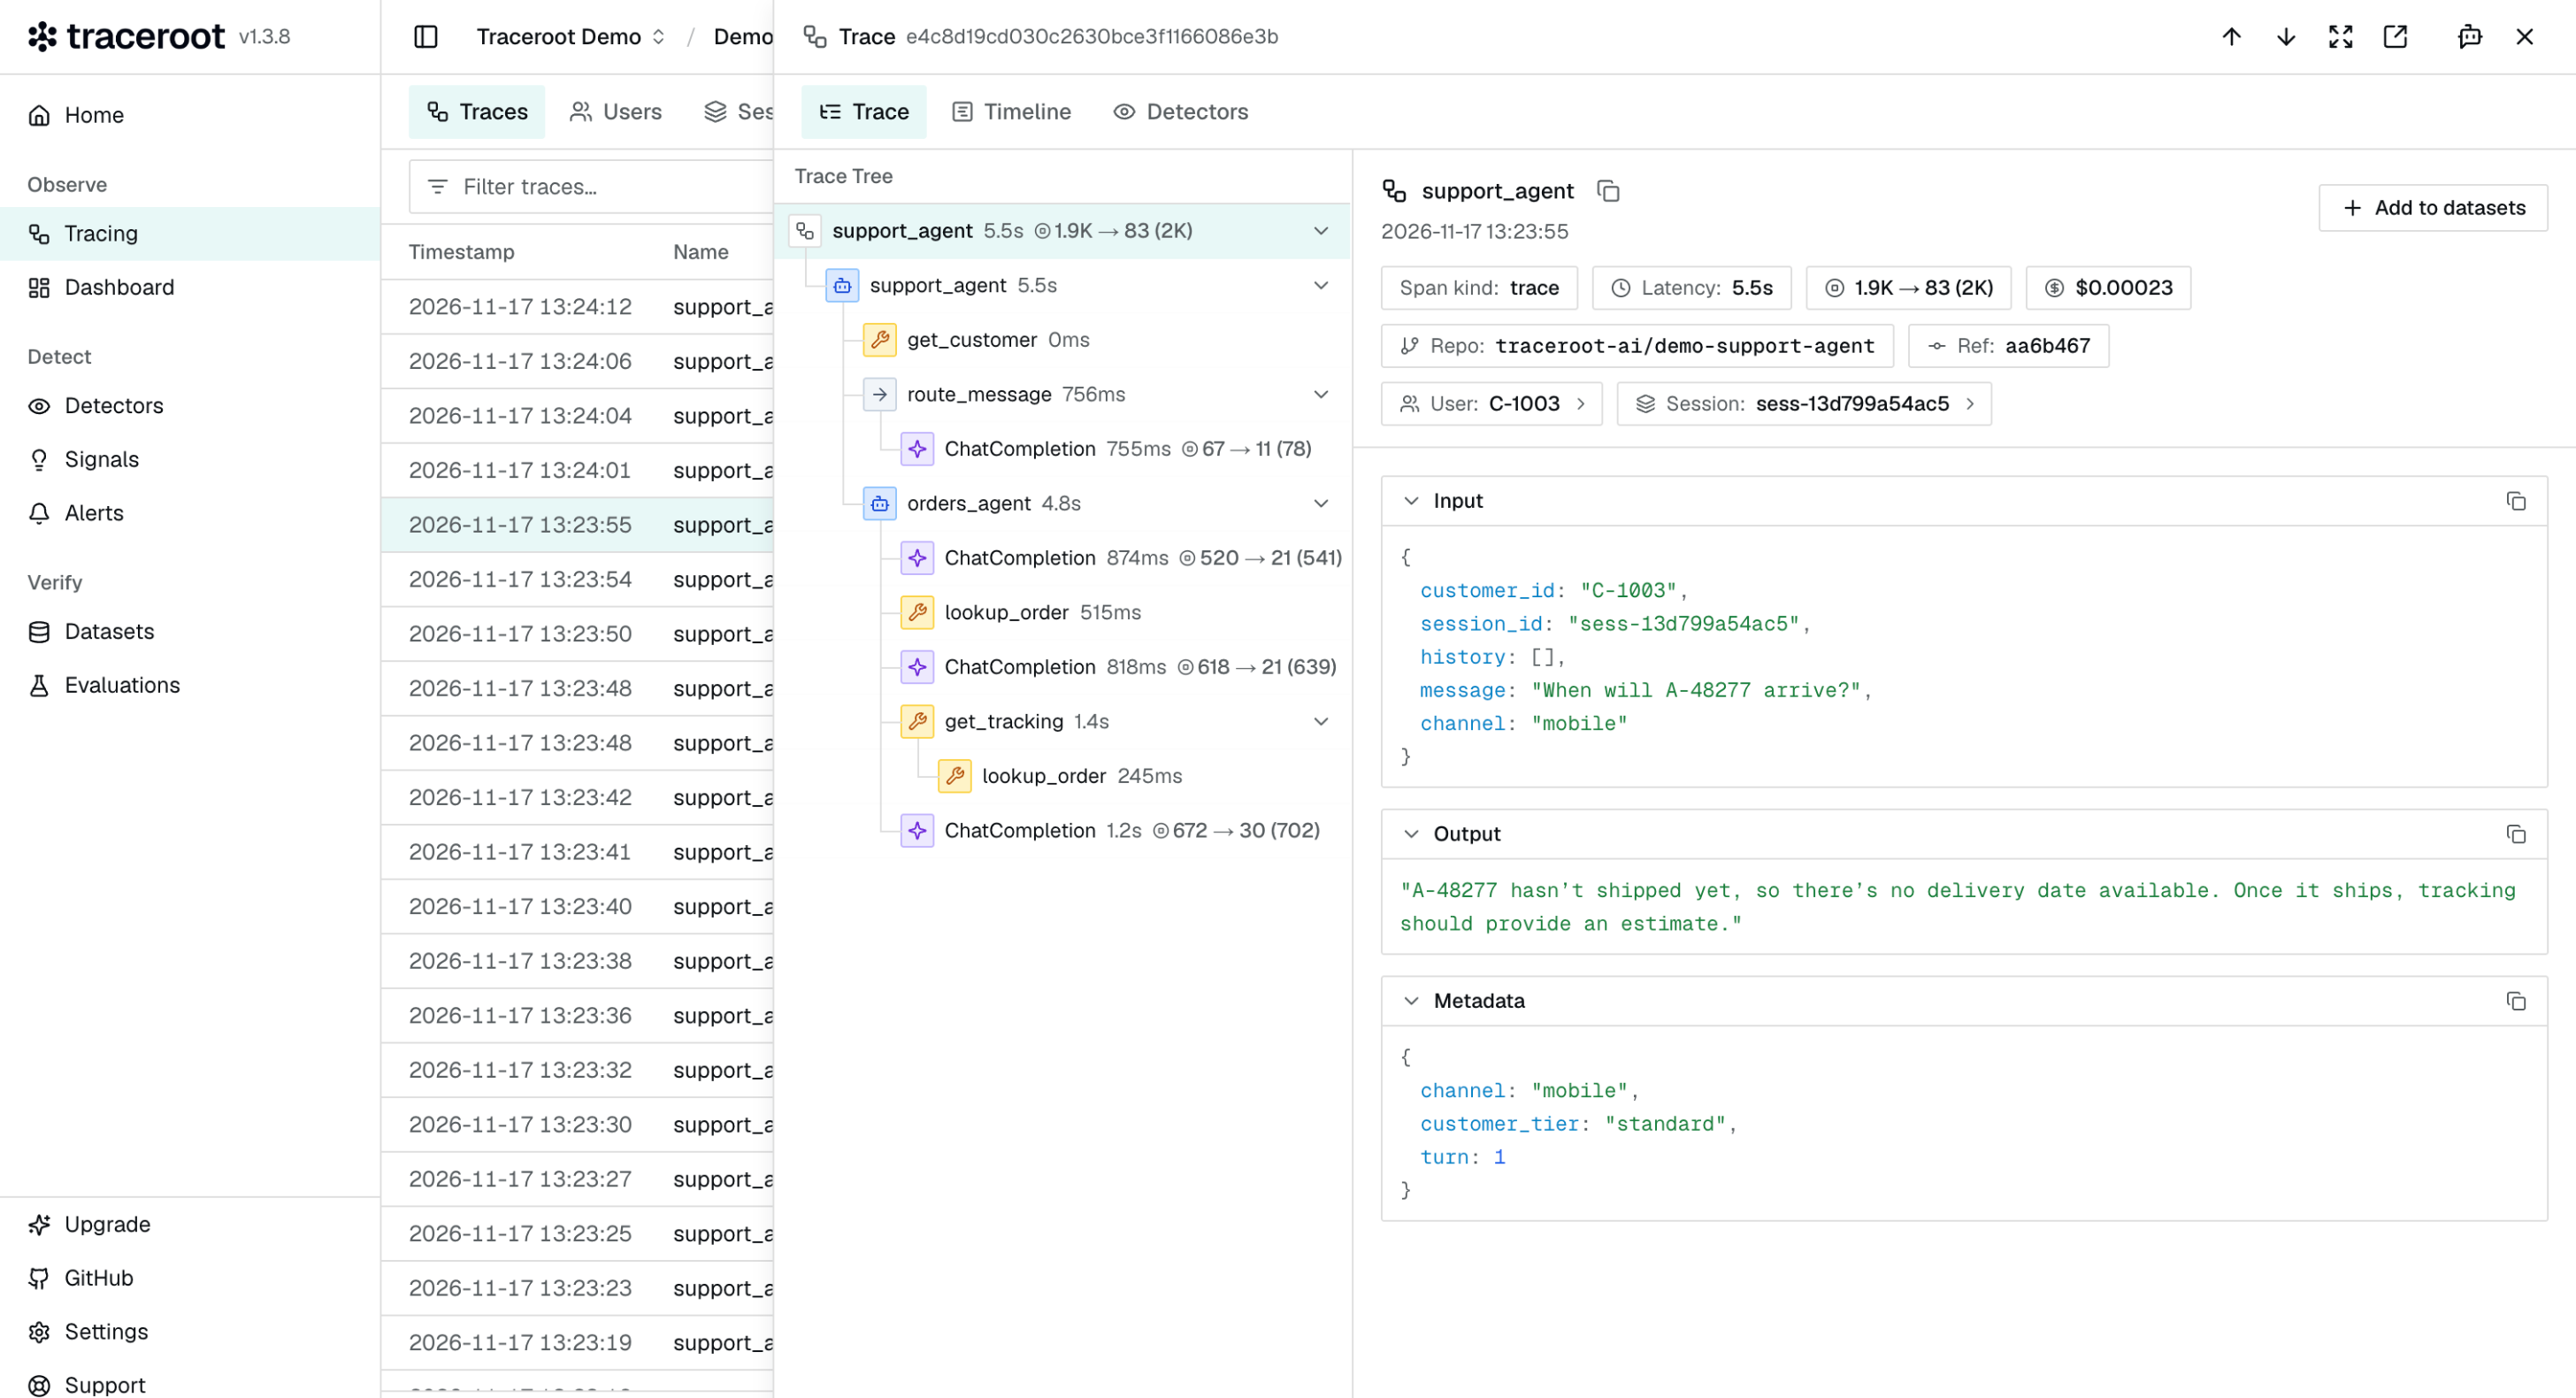
Detectors are plain-language descriptions of one problem, such as a hallucination, a logic error or an unfinished task. A judge model checks production traces against them, with a filter and a sampling rate you control. Flagged traces that share a problem are grouped into one Signal. A Signal is Open, Resolved or Dismissed, and a resolved Signal reopens by itself when a newer trace shows the problem again.
When a Signal opens, the root cause analysis agent can investigate it. The analysis is thorough because of the context it works with: an isolated sandbox, a coding agent built on pi-mono, the traces, a clone of your repository at the recorded commit, and recent GitHub activity. It returns the root cause, the code location, recent changes and a recommendation. If you ask for it, the agent can also implement the fix on a new branch and open a pull request for an engineer to review.
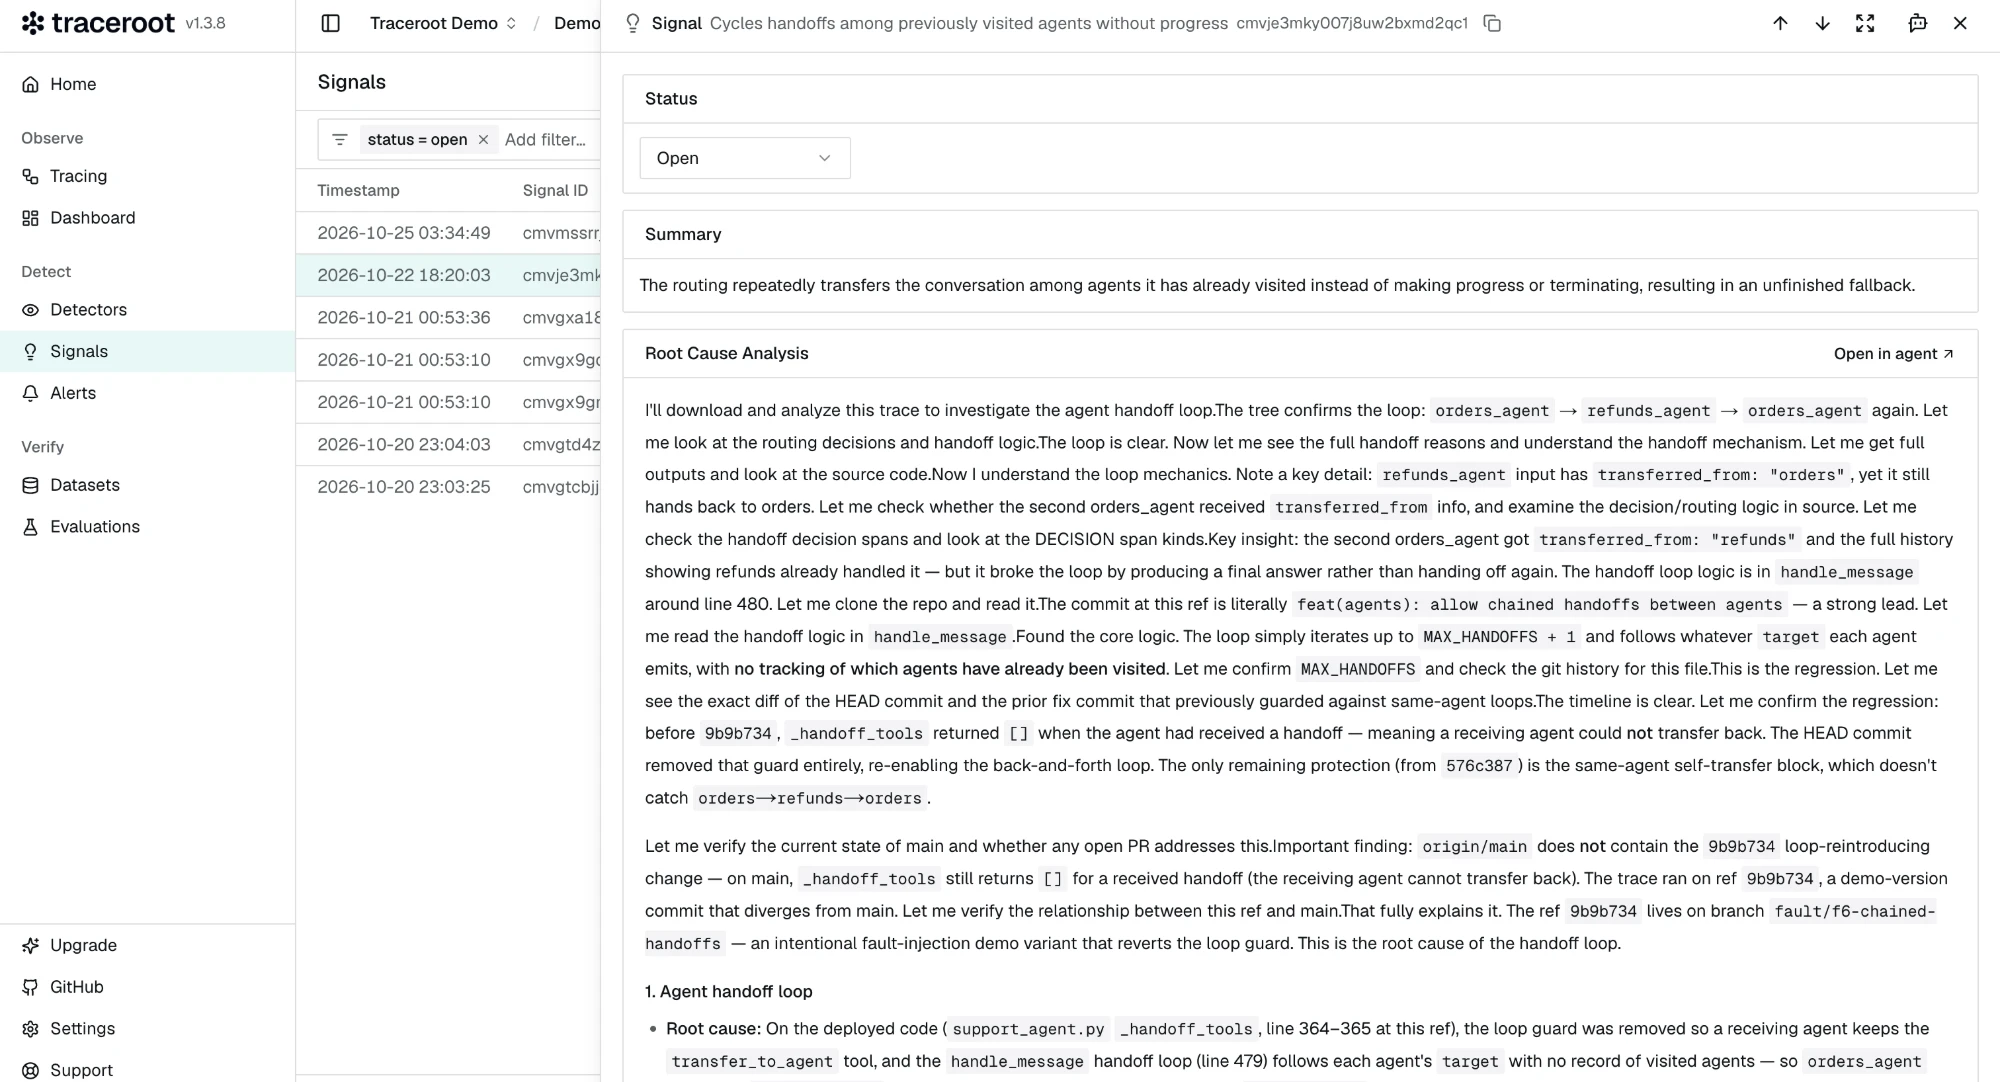
traceroot is also built for coding agents. One command, npx -y traceroot-cli@latest setup, connects a project and hands instrumentation to Claude Code, Codex or another agent. From the CLI, a coding agent can read traces and flagged traces, run read-only SQL, and create, update and delete detectors, alerts and dashboards.
Best for: Engineering teams that own a production agent and want a more agent-native product: failures clustered into Signals, traced to the code that ran, and optionally turned into a pull request with a fix.
Pros
- Open source and self-hostable: Run the whole platform yourself with Docker Compose or the Helm chart, including the root cause analysis agent.
- Full GitHub context on every trace: Repository and commit on the trace; file, line and function on each instrumented span.
- Detectors in plain language: Templates for failure, hallucination, logic error, task completion and safety, or start from a blank one.
- Signals: Flagged traces grouped by problem, with a status, and reopened automatically when the problem returns.
- Root cause analysis with full context: A sandboxed coding agent reads the traces and your code at the recorded commit, then recommends a fix and can optionally open a pull request.
- Bring your own key: Detectors and the agent run on your own model provider key, on every plan.
- A CLI for coding agents: Guided setup, JSON output on every command, read-only SQL, and plugins for Claude Code and Codex.
- Evaluation as the verify step: Datasets and evaluations with code scorers and LLM judges, where every case runs as its own trace.
Cons
- Code-aware root cause analysis needs the traceroot GitHub App connected to your repository.
- Writing a good detector takes a clear description of the failure you care about.
Pricing
- Free: 50k events per month, 2 seats, 15-day retention.
- Starter: $30 per month. 150k events per month, then $4 per 50k. Unlimited seats, 30-day retention.
- Pro: $200 per month. 90-day retention, SOC 2 report and HIPAA BAA.
- Enterprise: Custom pricing. See pricing details.
2. Langfuse
Langfuse describes itself as an open source AI engineering platform for agent evals and observability. It is built on OpenTelemetry, has SDKs for Python and JS/TS, and has been part of ClickHouse since January 2026. In production, you set up an evaluator and a rule to run LLM-as-a-judge or code checks on incoming observations, with filters and a sampling rate. Its in-app assistant, Halo, explores project data and takes actions in Langfuse with your approval.
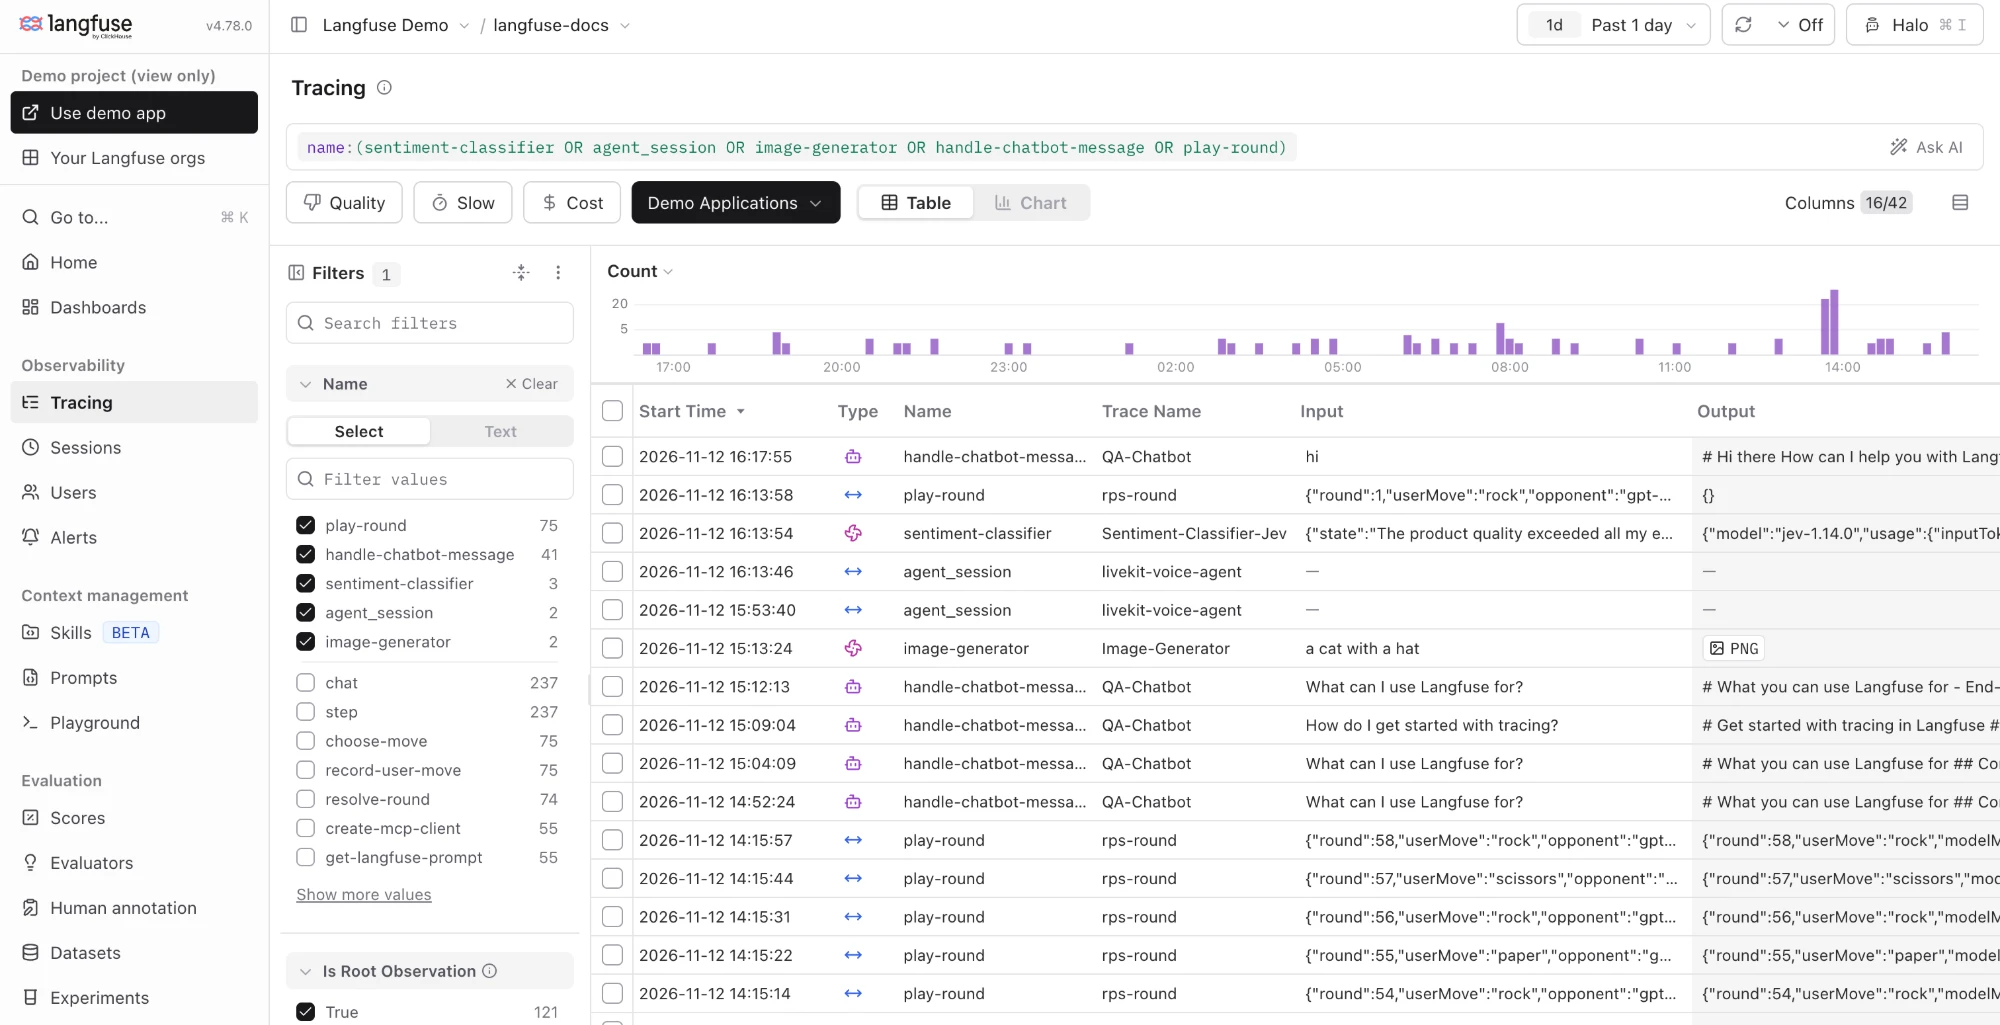
Best for: Teams that want open-source tracing and evaluation in one self-hostable tool.
Pros
- Open source and self-hostable, with the core features available when you run it yourself.
- Built on OpenTelemetry, so any OpenTelemetry-instrumented application can send traces.
- LLM-as-a-judge and code evaluators on production traffic, plus threshold-based alerts.
Cons
- The code version on a trace is a
releasefield, commonly set to a semantic version or a git commit hash. - Production evaluation outputs scores, and alerts fire on metric thresholds.
- On a self-hosted instance, some administration features such as project-level RBAC, audit logs and data retention policies need a license key.
Pricing
- Hobby: Free. 50k units per month, 2 users, 30 days of data access.
- Core: $29 per month. 100k units per month, then $8 per 100k. Unlimited users.
- Higher tiers: Pro and Enterprise. See pricing.
3. LangSmith
LangSmith is LangChain's platform for instrumenting an LLM application, investigating traces and monitoring performance in production. If you build with LangChain or LangGraph, you enable tracing with a single environment variable, and LangSmith also accepts OpenTelemetry traces from other stacks. Its agent, Engine, works from production traces: it surfaces recurring issues, diagnoses their root cause and proposes fixes. With a connected repository, it can open pull requests from fix branches it creates.
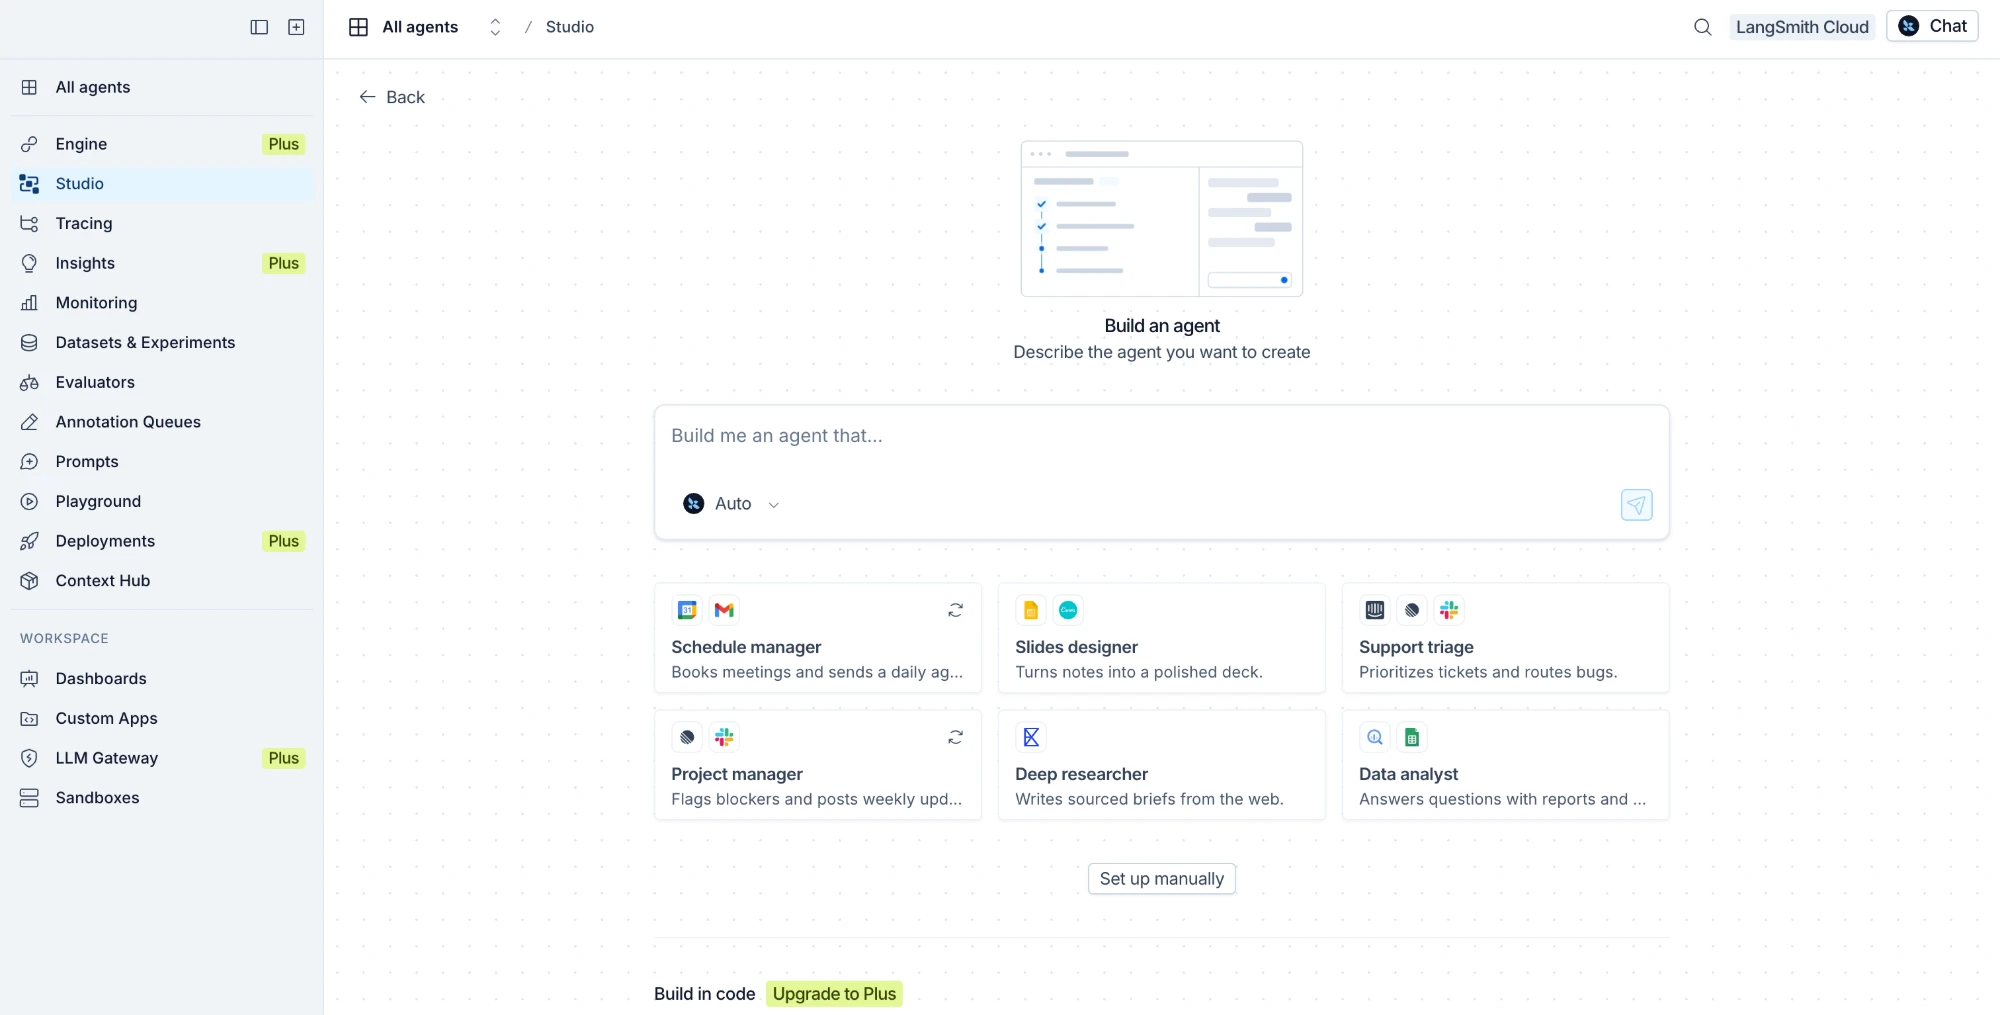
Best for: Teams building on LangChain or LangGraph that want tracing with almost no setup.
Pros
- Tracing for LangChain and LangGraph with a single environment variable.
- OpenTelemetry-based tracing for agents built on other stacks.
- Engine tracks an issue over time, adds new matching traces to it and reopens it if it resurfaces.
Cons
- The platform is not open source. Self-hosted and BYOC deployments are available on the Enterprise plan.
- Engine proposes code changes only for agents built with Deep Agents, LangChain and LangGraph.
- Priced per seat, with Engine metered separately.
Pricing
- Developer: Free. 1 seat, up to 5k base traces per month.
- Plus: $39 per seat per month. Up to 10k base traces per month, then pay as you go.
- Enterprise: Custom pricing. See pricing.
4. Braintrust
Braintrust is a commercial observability platform for instrumenting, understanding and improving agents. It accepts OpenTelemetry traces, and online scoring evaluates production traces as they are logged. Its agent, Loop, investigates logs, experiments and datasets across a project. With a connected GitHub repository, Loop can fix code and open pull requests for review.
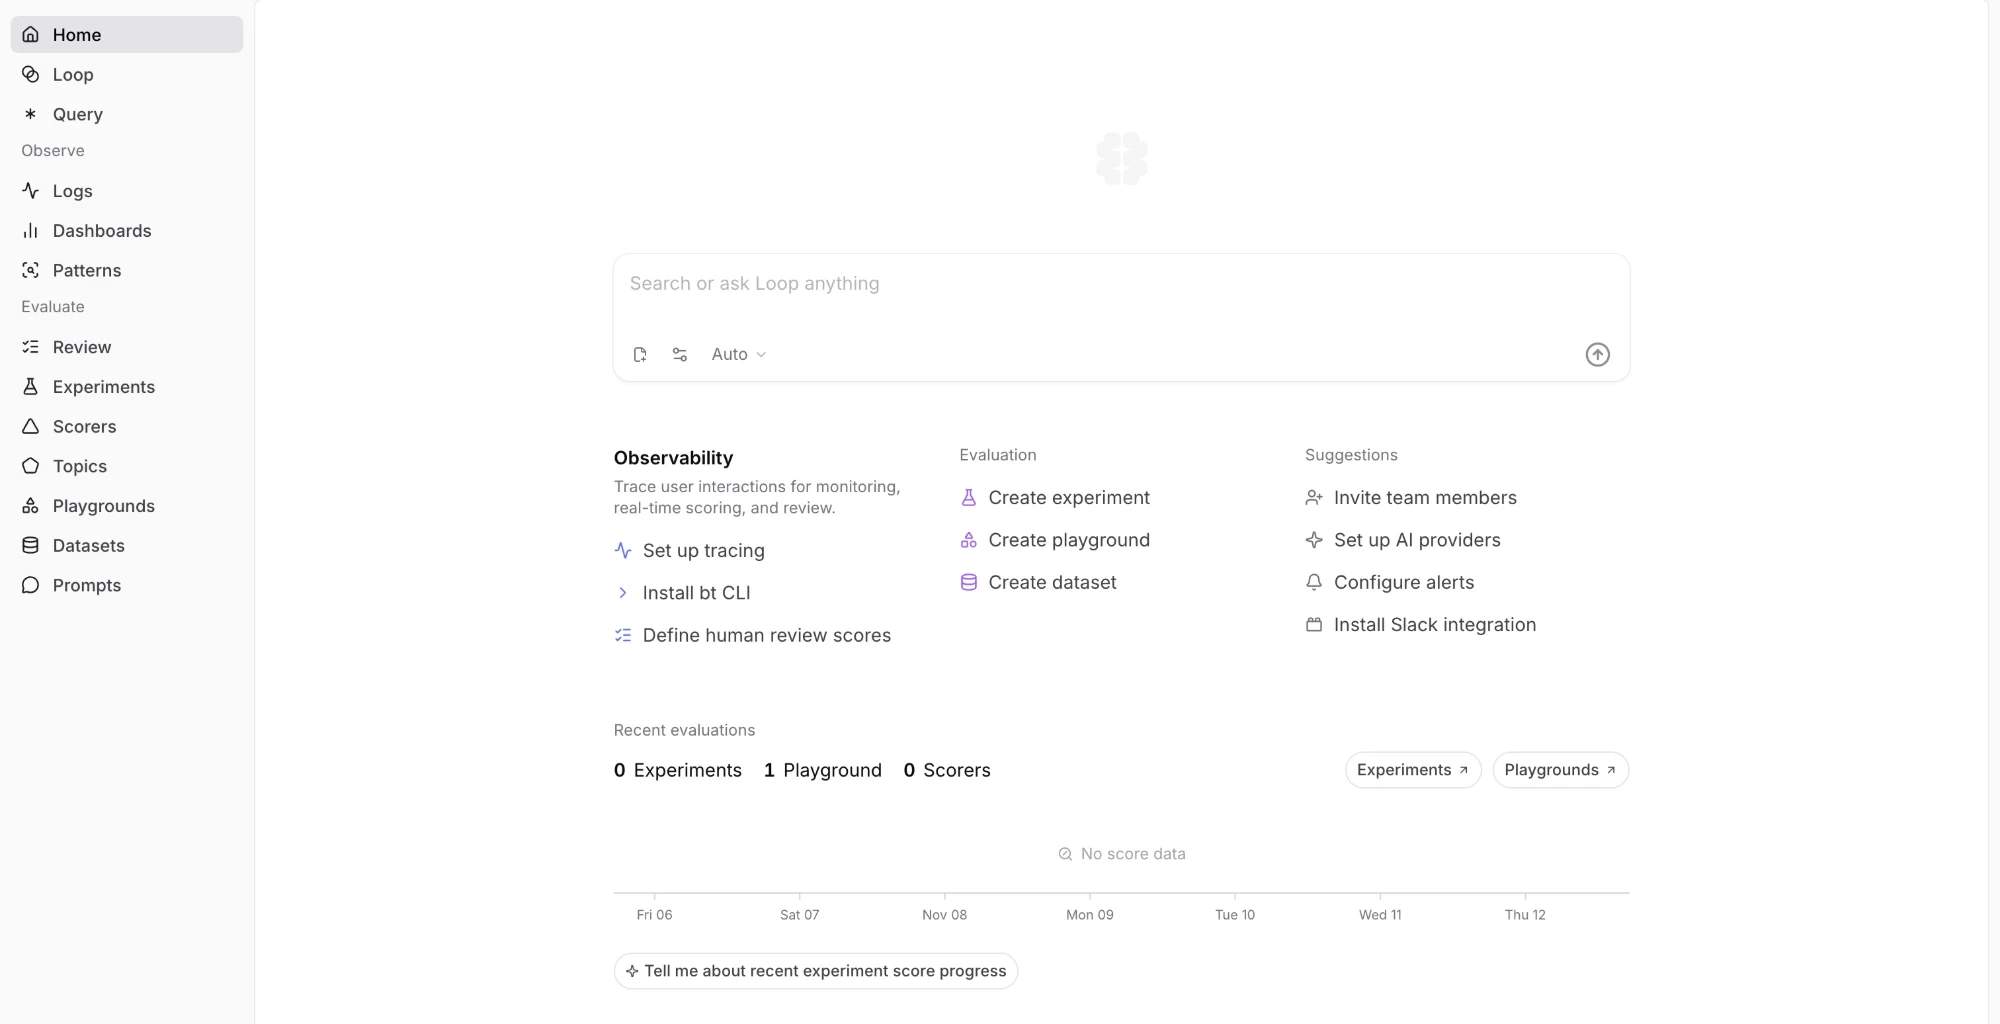
Best for: Teams that want a managed evaluation platform and are comfortable with a closed one.
Pros
- Online scoring on production traces, running in the background as they are logged.
- Loop investigates project data and, with repository write access, can open pull requests.
- Plans are not priced per seat.
Cons
- The platform is not open source. Running it in your own cloud is BYOC on the Enterprise plan, where Braintrust operates the data plane and hosts the control plane.
- Each repository checkout Loop makes starts with the latest default-branch commit, which may not be the version that produced the trace.
- Loop runs on the GPT models Braintrust lists. Configuring another provider does not add its models.
Pricing
- Starter: Free. 1 GB of processed data, 10k scores, 14-day retention.
- Pro: $249 per month. 5 GB of processed data, 50k scores.
- Enterprise: Custom pricing. See pricing.
5. Arize Phoenix
Phoenix is Arize's open-source AI observability platform for experimentation, evaluation and troubleshooting. It is built on OpenTelemetry through OpenInference instrumentation, and it is free to self-host with no feature gates. You can run evaluations on traces, experiment results or any dataset. Its assistant, PXI, runs on your own model key and investigates failing traces. Arize's commercial product, Arize AX, is a separate platform that adds the production features below.
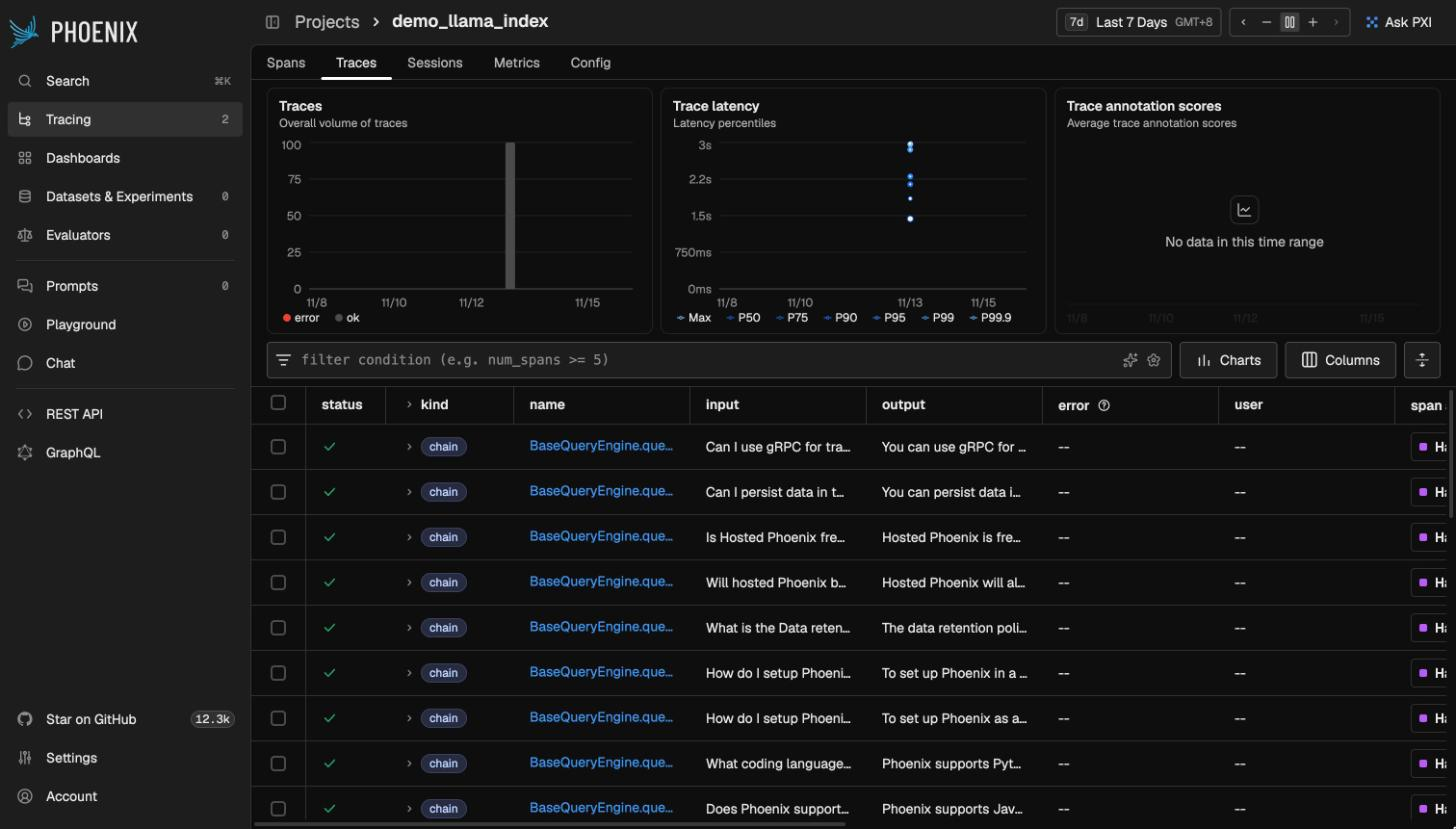
Best for: Teams that want a self-hosted, OpenTelemetry-native tool for tracing and evaluation during development.
Pros
- Free to self-host, with no feature gates inside Phoenix.
- Built on OpenTelemetry and framework agnostic.
- Evaluations on traces, experiments and datasets, and an assistant that runs on your own model key.
Cons
- Continuous evaluation of production traffic with alerting and monitors is part of Arize AX, not Phoenix.
- Signal, which groups recurring failure patterns into issues, is also part of Arize AX, and attaching a repository for fix pull requests is on its Enterprise plan.
Pricing
- Phoenix: Free to self-host.
- Arize AX Free: 25k spans per month, 15-day retention.
- Arize AX Pro: $50 per month. 50k spans per month, 30-day retention.
- Arize AX Enterprise: Custom pricing. See pricing.
6. Opik
Opik is Comet's open-source LLM observability and evaluation platform. It has Python and TypeScript SDKs plus OpenTelemetry support, and online evaluation rules that run an LLM judge or Python code on new traces. Diagnostics scans a project's traces and groups repeated failures into a single issue with a root cause and a suggested fix. Its assistant, Ollie, can read your source files and propose code changes once you pair a local project with opik connect.
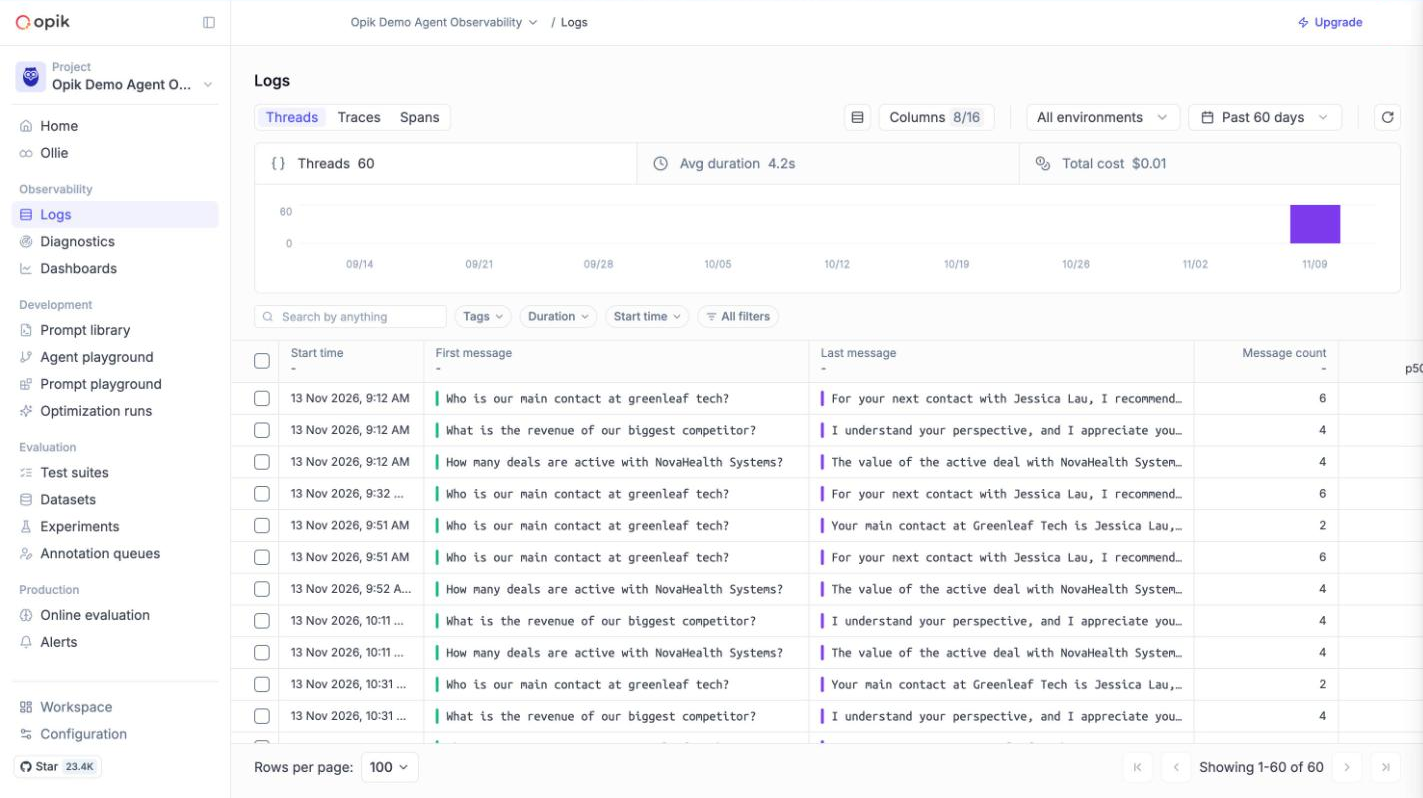
Best for: Teams that want open-source tracing and evaluation with an assistant that works on a local project.
Pros
- Open source, and the full platform can be self-hosted.
- Online evaluation rules for traces, threads and spans.
- Diagnostics groups repeated failures into issues and suggests a fix.
Cons
- Ollie works on the local project you connect. A proposed change is a diff you approve, applied to files on your machine.
- Diagnostics scans run on Ollie credits, and on a self-hosted instance Diagnostics is available only when Ollie is enabled.
- The self-hosted version comes without user management features.
Pricing
- Open source: Free to self-host.
- Free Cloud: 25k spans per month, 60-day retention.
- Pro Cloud: $19 per month. 100k spans per month, then $5 per 100k.
- Enterprise: Custom pricing. See pricing.
Best AI observability tools compared (2026)
| Tool | Best for | Notable features | Starting price |
|---|---|---|---|
| traceroot | Engineering teams that want full agent observability and a way to keep improving the agent in production | Open source and self-hostable, agent tracing with cost and token tracking, sessions, dashboards and alerts, datasets and evaluations, LLM judge on production traces (detectors), Signals, root cause analysis with full GitHub context, optional pull requests, CLI for coding agents | Free (Starter: $30/month) |
| Langfuse | Open-source tracing and evaluation | Open source and self-hostable, OpenTelemetry-based SDKs, LLM-as-a-judge on production traffic, Halo assistant | Free (Core: $29/month) |
| LangSmith | LangChain and LangGraph teams | One-variable tracing for LangChain, online evaluations, Engine for recurring issues and pull requests | Free (Plus: $39/seat/month) |
| Braintrust | Managed evaluation platform | Online scoring, Loop agent, pull requests from a connected repository | Free (Pro: $249/month) |
| Arize Phoenix | Self-hosted tracing and evaluation in development | OpenTelemetry-native, evaluations on traces and datasets, PXI assistant | Free to self-host (Arize AX Pro: $50/month) |
| Opik | Open-source tracing with a local assistant | Open source and self-hostable, online evaluation rules, Diagnostics, Ollie | Free (Pro Cloud: $19/month) |
All six ingest OpenTelemetry. Prices and plan limits were read from each vendor's pricing page on November 14, 2026.
Which AI observability tool should you choose?
The right tool depends less on the feature list and more on where your team is.
Solo developers and side projects. Start with a free plan and one agent. Every tool here has a free plan or a self-hosted version, so pick the one that takes the least time to instrument. With traceroot, that is one setup command run by your coding agent.
Early-stage startups with an agent in production. Your problem is no longer seeing traces. It is knowing which failures matter and getting them fixed between everything else. Choose a tool that groups failures into problems and brings the code into the investigation. This is where traceroot fits best.
Teams committed to one framework. If everything you build is LangChain or LangGraph, LangSmith's native tracing is hard to ignore. Most other frameworks work well with any tool here over OpenTelemetry.
Enterprises with security and deployment requirements. Ask two questions first: can we run the whole platform ourselves, and can we read the code that handles our traces? An open-source, self-hostable tool answers both. A closed platform usually offers a managed deployment in your cloud on its Enterprise plan.
You do not have to choose only one. Because every tool here accepts OpenTelemetry, you can send one agent's traces to two tools and compare them on real failures before you commit.
Why traceroot for agent improvement
Most observability tools stop at the trace or the score. Both are useful, and neither tells you what to change. traceroot is built around the step after that.
The difference starts with context. Every trace records the repository and commit that ran, and every instrumented span records its file, line and function. So when a detector flags a run and the flagged traces are grouped into a Signal, the root cause analysis agent does not start from a guess about the code. It works in a sandbox with a coding agent, the traces and a clone of your repository at that commit. That is why its analysis can name a file and a recent change, and why a pull request is something you opt into once you trust the diagnosis.
The second difference is openness. traceroot is open source and self-hostable, including the agent that reads your code, and detectors and the agent run on your own model key. You can read exactly what touches your traces and your repository, and extend it when you need to.
The third is that it is built for coding agents. Setup, instrumentation and day-to-day work all run through a CLI that Claude Code or Codex can drive, so the agent that writes your code can also read what happened in production.
Start with one agent: run npx -y traceroot-cli@latest setup in its repository, or read the code on GitHub.
FAQs: AI observability tools
What is AI observability?
AI observability is how teams see and judge what an LLM application or agent does in production. It combines traces of each request, metrics such as cost and latency, evaluations of output quality, and analysis that groups failures and looks for their cause.
How is AI observability different from traditional monitoring?
Traditional monitoring tells you whether a request succeeded and how long it took. An agent can succeed on both counts and still give a wrong answer. AI observability records the steps the agent took and evaluates the result, so quality problems show up even when nothing errored.
Which AI observability tools are open source?
traceroot, Langfuse and Opik are open source and self-hostable, and Arize describes Phoenix as open source and free to self-host. LangSmith and Braintrust publish their SDKs, and their platforms are closed.
Which tool connects a production failure to a fix?
traceroot groups flagged traces into Signals, runs root cause analysis against your repository at the commit recorded on the trace, and can optionally open a pull request. LangSmith Engine and Braintrust Loop can also open pull requests from a connected repository, on closed platforms.
Can I use more than one AI observability tool at once?
Yes. All six tools in this guide ingest OpenTelemetry, so the same instrumentation can send traces to two of them. Many teams try a new tool on one agent next to the one they already run.
How do I get started with traceroot?
Run npx -y traceroot-cli@latest setup in one agent's repository. The CLI signs you in, creates a project, hands instrumentation to your coding agent and waits for the first trace. Then write one detector for a failure you already understand, and connect the GitHub App so root cause analysis can read your code.
Competitor facts were checked against each vendor's public documentation, pricing page and repository on November 14, 2026.