traceroot vs. PostHog
An open-source alternative to PostHog AI Observability (formerly PostHog LLM analytics), compared at the source level: ingestion, evals, root cause, pricing.
 Xinwei HePublished 18 min read
On this page
An agent gave a customer the wrong refund amount, and you want to know which line of code made it do that. traceroot and PostHog AI Observability, formerly PostHog LLM analytics, are both open source, both store traces in ClickHouse, and both can turn a bad trace into a pull request. Because you can read both codebases, this post compares them at the source level: what each one ingests, what it stores, how it judges production traffic, and what it does with a failure. PostHog facts were checked against PostHog's public docs and the PostHog repository at commit 3963420 in November 2026.
TL;DR
Every span, or only the LLM spans. traceroot stores every span in an OpenTelemetry batch and reads both OpenInference and GenAI attributes. PostHog turns LLM activity into $ai_ events. Its OTLP endpoint keeps spans that carry GenAI attributes and skips the rest.
Full GitHub context on every trace. The traceroot SDK records the repository and Git ref on every span, and the file, line and function for instrumented functions. Repository and commit are not among PostHog's documented $ai_ properties, so on PostHog you add them yourself.
Judged traces become Signals that reopen. A traceroot detector judges each sampled trace about a minute after its last span arrives, and a Resolved Signal reopens by itself when the problem comes back. PostHog evaluations grade generations, traces or sessions, and its Self-driving reports stay resolved: a recurrence files a new report.
Root cause analysis reads your code at the recorded commit. traceroot's agent clones your repository at the commit on the trace into a sandbox and can optionally open a pull request, with analysis runs included in every plan. PostHog's Self-driving agents research reports in your connected repository and can open pull requests too, billed in AI credits.
One agent product, or one product among many. traceroot prices one thing, agent traces, with detector runs and root cause analyses included in each plan. AI Observability is one of many products on PostHog's usage-based pricing: 100,000 free AI events a month, shared with evaluations, then from $0.00035 an event, with Self-driving work billed in AI credits. At 1,000 runs a day with 10 spans each, traceroot Starter is $46 a month, and PostHog's AI events alone come to at most $70 at the starting rate.
Choose traceroot if you want an open-source, self-hostable platform built to keep improving agents in production, with every span kept and analysis runs included in the plan: from a judged trace to a Signal, to a root cause in the code that ran, to an optional pull request, with a CLI your coding agent can drive.
Choose PostHog if your product already runs on PostHog and you want each LLM trace next to the user who triggered it, their session replay and any exceptions, with product analytics, feature flags and experiments on the same platform.
At a glance
| PostHog AI Observability | traceroot | |
|---|---|---|
| Open source | ✓ | ✓ |
| Self-hosting | ✓ Hobby deploy | ✓ |
| OpenTelemetry ingestion | ✓ LLM spans only | ✓ |
| Framework integrations | ✓ | ✓ |
| Cost and token tracking | ✓ | ✓ |
| Sessions | ✓ | ✓ |
| Datasets and experiments | ✓ | ✓ |
| LLM judge on production traces | ✓ Evaluations | ✓ Detectors |
| CLI | ✓ | ✓ |
| Opens a pull request | ✓ Off by default | ✓ Optional |
| Repository and Git context on traces | Via custom properties | ✓ SDK Git context |
| Recurring failures tracked with a status | Daily clusters | ✓ Signals |
| Reads your code at the traced commit | Connected repository | ✓ |
| Prompt and completion content kept | 30 days | Plan retention |
| Agent work | AI credits | Included |
| Paid plans from | Usage-based, from $0.00035 an event | $30 a month |
Open source and self-hosting
Traces hold your prompts, your customers' words and every tool call your agent made. Both projects publish the code that stores them, and both let you run it yourself.
traceroot is open source and self-hostable. make prod in the repository brings up the full stack with Docker Compose: the web app, the API, the ingest worker, the detector worker, the root cause analysis agent and the databases (docker-compose.prod.yml). Signals work on every plan, including self-hosted, and root cause analysis has no run limit when you self-host (Signals). The SDKs and the CLI live in their own repositories (traceroot-py, traceroot-ts, traceroot-cli).
PostHog is open source too, and its docs say the self-hosted version "is the same exact product we run on PostHog Cloud" (Self-host PostHog). The supported way to run it is a Docker Compose "hobby" deploy. PostHog calls self-hosted deployments "officially unsupported", says the deploy is "made for hobbyists", and notes that "everything runs on a single machine, and thus is unlikely to scale past a couple 100ks events without significant effort in scaling" (disclaimer).
Architecture, from SDK to storage
Both platforms put traces in ClickHouse. What reaches ClickHouse, and in what shape, is where they part.
traceroot buffers each OTLP batch in object storage, a worker writes every span to ClickHouse, and detectors judge finished traces. PostHog's Rust capture service turns LLM calls and GenAI spans into ai events, which go through Kafka into ClickHouse.
traceroot is split into services. The public traces endpoint stores each OTLP request body in S3 or MinIO exactly as received, then queues a task with a pointer to it (traces.py). A Celery worker decodes the batch and writes it to ClickHouse (ingest_tasks.py). Because the raw body is stored first, a batch that fails every attempt is moved aside where it can be inspected or replayed (ingest_quarantine.py).
Every span in the batch is kept. The worker classifies each one from traceroot.span.type, OpenInference's openinference.span.kind or the GenAI gen_ai.operation.name, and a span that matches none of them is stored as a plain span (otel_transform.py). Spans live in a ClickHouse ReplacingMergeTree table ordered by project, trace and start time, with first-class git_source_file, git_source_line and git_source_function columns (005_rebuild_spans_trace_id_order.sql).
PostHog's AI data enters through its Rust capture service, which has dedicated routes for AI events: /i/v0/ai for events sent by the SDKs and /i/v0/ai/otel for OTLP (router.rs). The AI route accepts events up to 8MB, more than regular capture (large events). The OTLP route caps a request at 4MB and 100 AI spans (otel/mod.rs), and it only converts spans whose attributes start with gen_ai., ai., eve., traceloop. or pydantic_ai. (providers.rs). Each $ai_ event then lands twice: a full copy in the ai_events table, ordered by team, trace and timestamp with a 30-day default retention, and a copy without the large properties in the main events table (ai_events/sql.py, retention_days, data retention).
| Dimension | PostHog AI Observability | traceroot |
|---|---|---|
| Unit of data | $ai_generation, $ai_span, $ai_trace and $ai_embedding events |
OpenTelemetry spans and traces |
| Span store | ClickHouse ai_events table, plus a trimmed copy in events |
ClickHouse spans table |
| Ingest path | Rust capture service, then Kafka | Durable S3 or MinIO buffer, then a worker |
| OTel spans without LLM attributes | Not converted into events | Stored as plain spans |
| Prompt and completion content | Kept 30 days; model, tokens, cost and latency stay longer | Kept for the project's retention |
Tracing, OpenTelemetry and git context
Both tools trace an agent step by step and work with the common frameworks. traceroot's Python SDK depends on the OpenInference instrumentors for OpenAI, Anthropic, LangChain, LlamaIndex, CrewAI, the OpenAI Agents SDK, Google GenAI, Bedrock and more (pyproject.toml), and the TypeScript SDK uses the @arizeai/openinference-* packages (package.json). The ingest worker also reads GenAI semantic conventions, so spans from native OpenTelemetry instrumentors work too.
What traceroot adds on top is full GitHub context. When the client starts, it resolves the repository and Git ref from explicit settings first, then TRACEROOT_GIT_REPO and TRACEROOT_GIT_REF, then CI variables, then files written at build time, then the local .git directory (client.py). The span processor stamps traceroot.git.repo and traceroot.git.ref on every recording span (span_processor.py), and the observe decorator records the caller's file, line and function (git_context.py). For images without a .git directory, the repository and commit can be injected at build time.
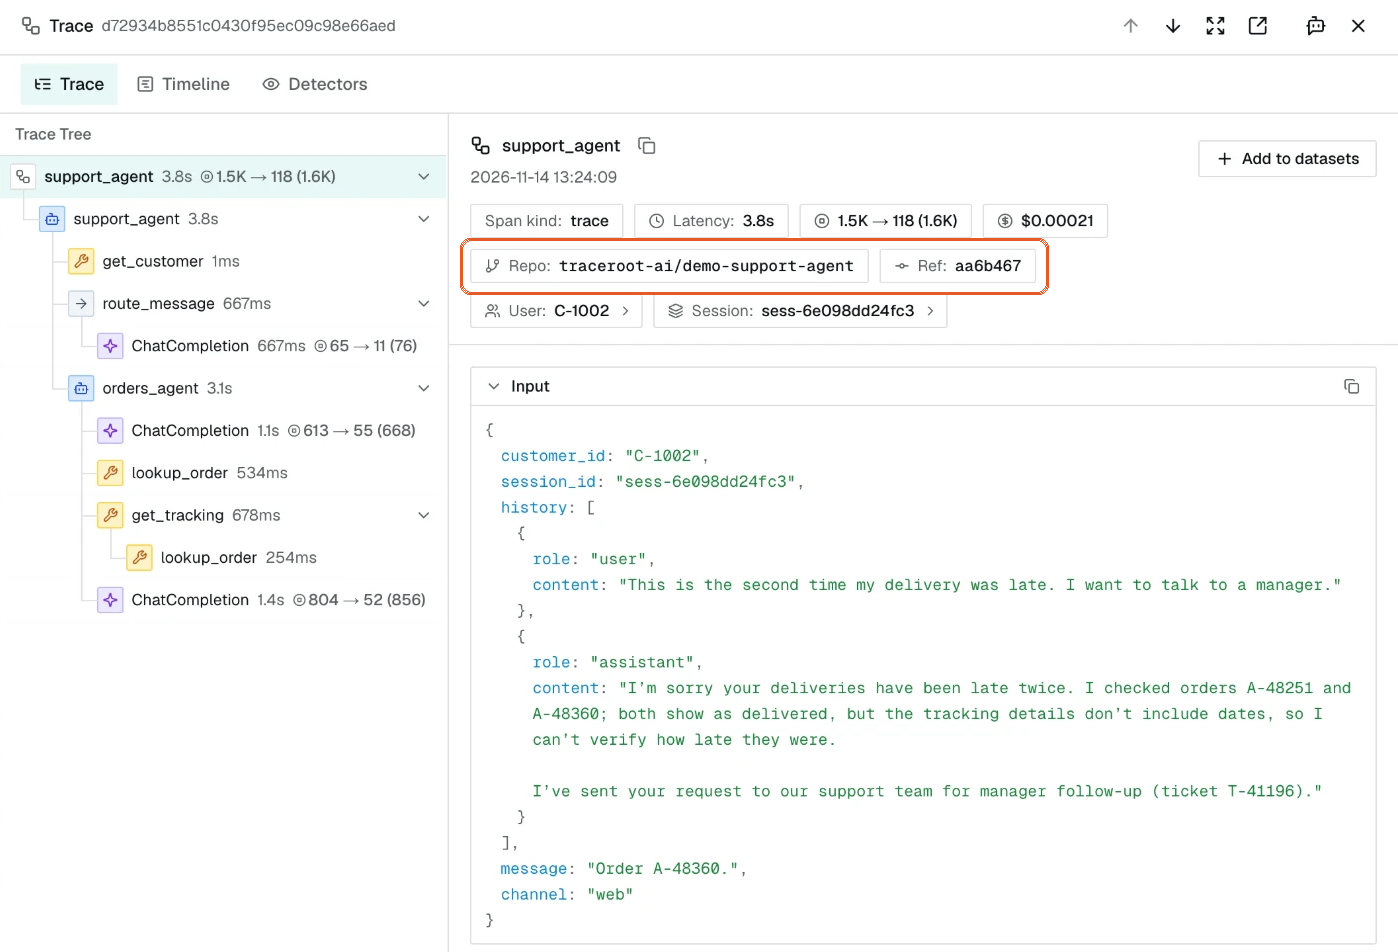
PostHog captures LLM calls with SDK wrappers around each provider and framework (installation), or from OpenTelemetry. A generation records the model, input, output, tool calls, tokens, cost and latency. Repository and commit are not among the documented $ai_ properties, so you attach them yourself as custom properties. For offline evaluation runs in CI, PostHog's docs suggest recording "your agent's commit SHA in application_version" (offline evals).
| Dimension | PostHog AI Observability | traceroot |
|---|---|---|
| Instrumentation | PostHog SDK wrappers, plus GenAI, Vercel AI SDK, Traceloop and Pydantic AI spans over OTLP | OpenInference, wrapped by the traceroot SDKs, plus GenAI conventions |
| Repository and Git ref | Your own custom properties | Resolved by the SDK and stamped on every span |
| File, line and function | Not in the documented properties | Recorded for instrumented functions, stored as columns |
| Trace export with git context | Query the ai_events table |
traceroot traces export writes git_context.json next to the spans |
Detectors and Signals, evaluations and reports
traceroot is built for one job: helping you keep improving your agents in production. A detector is a plain-language description of one behavior you want to catch, such as a wrong answer or an unfinished task, that a judge model checks traces against.
The trigger path is in the open-source backend. The ingest batch that carries a trace's root span takes a Redis lock, checks the detector's filters and a deterministic sample, and enqueues one delayed job. The worker then waits until the trace has been quiet for 60 seconds before judging it (detector_tasks.py). Every sampled trace gets its own verdict, once.
When a detector says yes, the trace is flagged and grouped into a Signal within about a minute. A Signal is Open, Resolved or Dismissed. A Resolved Signal reopens by itself when a trace that started after the fix shows the problem again, and the next notification lists it as Reopened, so you see when a fix did not hold.
PostHog evaluations run on the server too. An LLM judge scores production data against a prompt you write, and each evaluation picks what one run grades: each generation, right after it is ingested; a whole trace, after the trace settles; or a whole session. Sampling ranges from 0.1% to 100%. For traces, the workflow starts on the first matching $ai_generation and then waits, by default for a fixed 30-minute window, or until the trace has been quiet for 5 minutes if you choose the inactivity strategy (evaluation_configs.py, run_trace_evaluation.py).
Grouping happens in two places. Clusters run as daily jobs that group similar traces, generations or evaluation results from recent days. With Self-driving, an agent reviews each batch of evaluation results and files signals to an inbox, where related signals are grouped into reports. PostHog treats a resolved report as final: "a resolved report never quietly reopens", and a recurrence files a fresh report.
| Dimension | PostHog AI Observability | traceroot |
|---|---|---|
| Judge on production traffic | Server-side evaluation on generations, traces or sessions | Server-side detector on each sampled trace |
| When a trace is judged | After a 30-minute window by default, or 5 quiet minutes | After 60 seconds without a new span |
| Grouping | Daily clusters; Self-driving reports in an inbox | Each flagged trace joins a Signal as it arrives |
| After a fix | A resolved report stays resolved; a new report is filed | A Resolved Signal reopens on regression |
| Alerts | Evaluation reports by email or Slack | Email and Slack digests for new and reopened Signals |
Root cause analysis and pull requests
With automatic root cause analysis on, a new or reopened Signal starts an investigation. You can also run one by hand.
A root cause is only as good as the context behind it. traceroot's agent is a coding agent, powered by pi-mono, that runs in an isolated sandbox. It clones your repository at the commit recorded on the trace, reads the traces behind the Signal and the file and line on the failing span, and returns a root cause, the code location and a recommended fix. The sandbox can read trace data and source code, but not your production databases or APIs. In docker-compose.prod.yml, the agent is its own service, with Docker or Daytona as the sandbox provider.
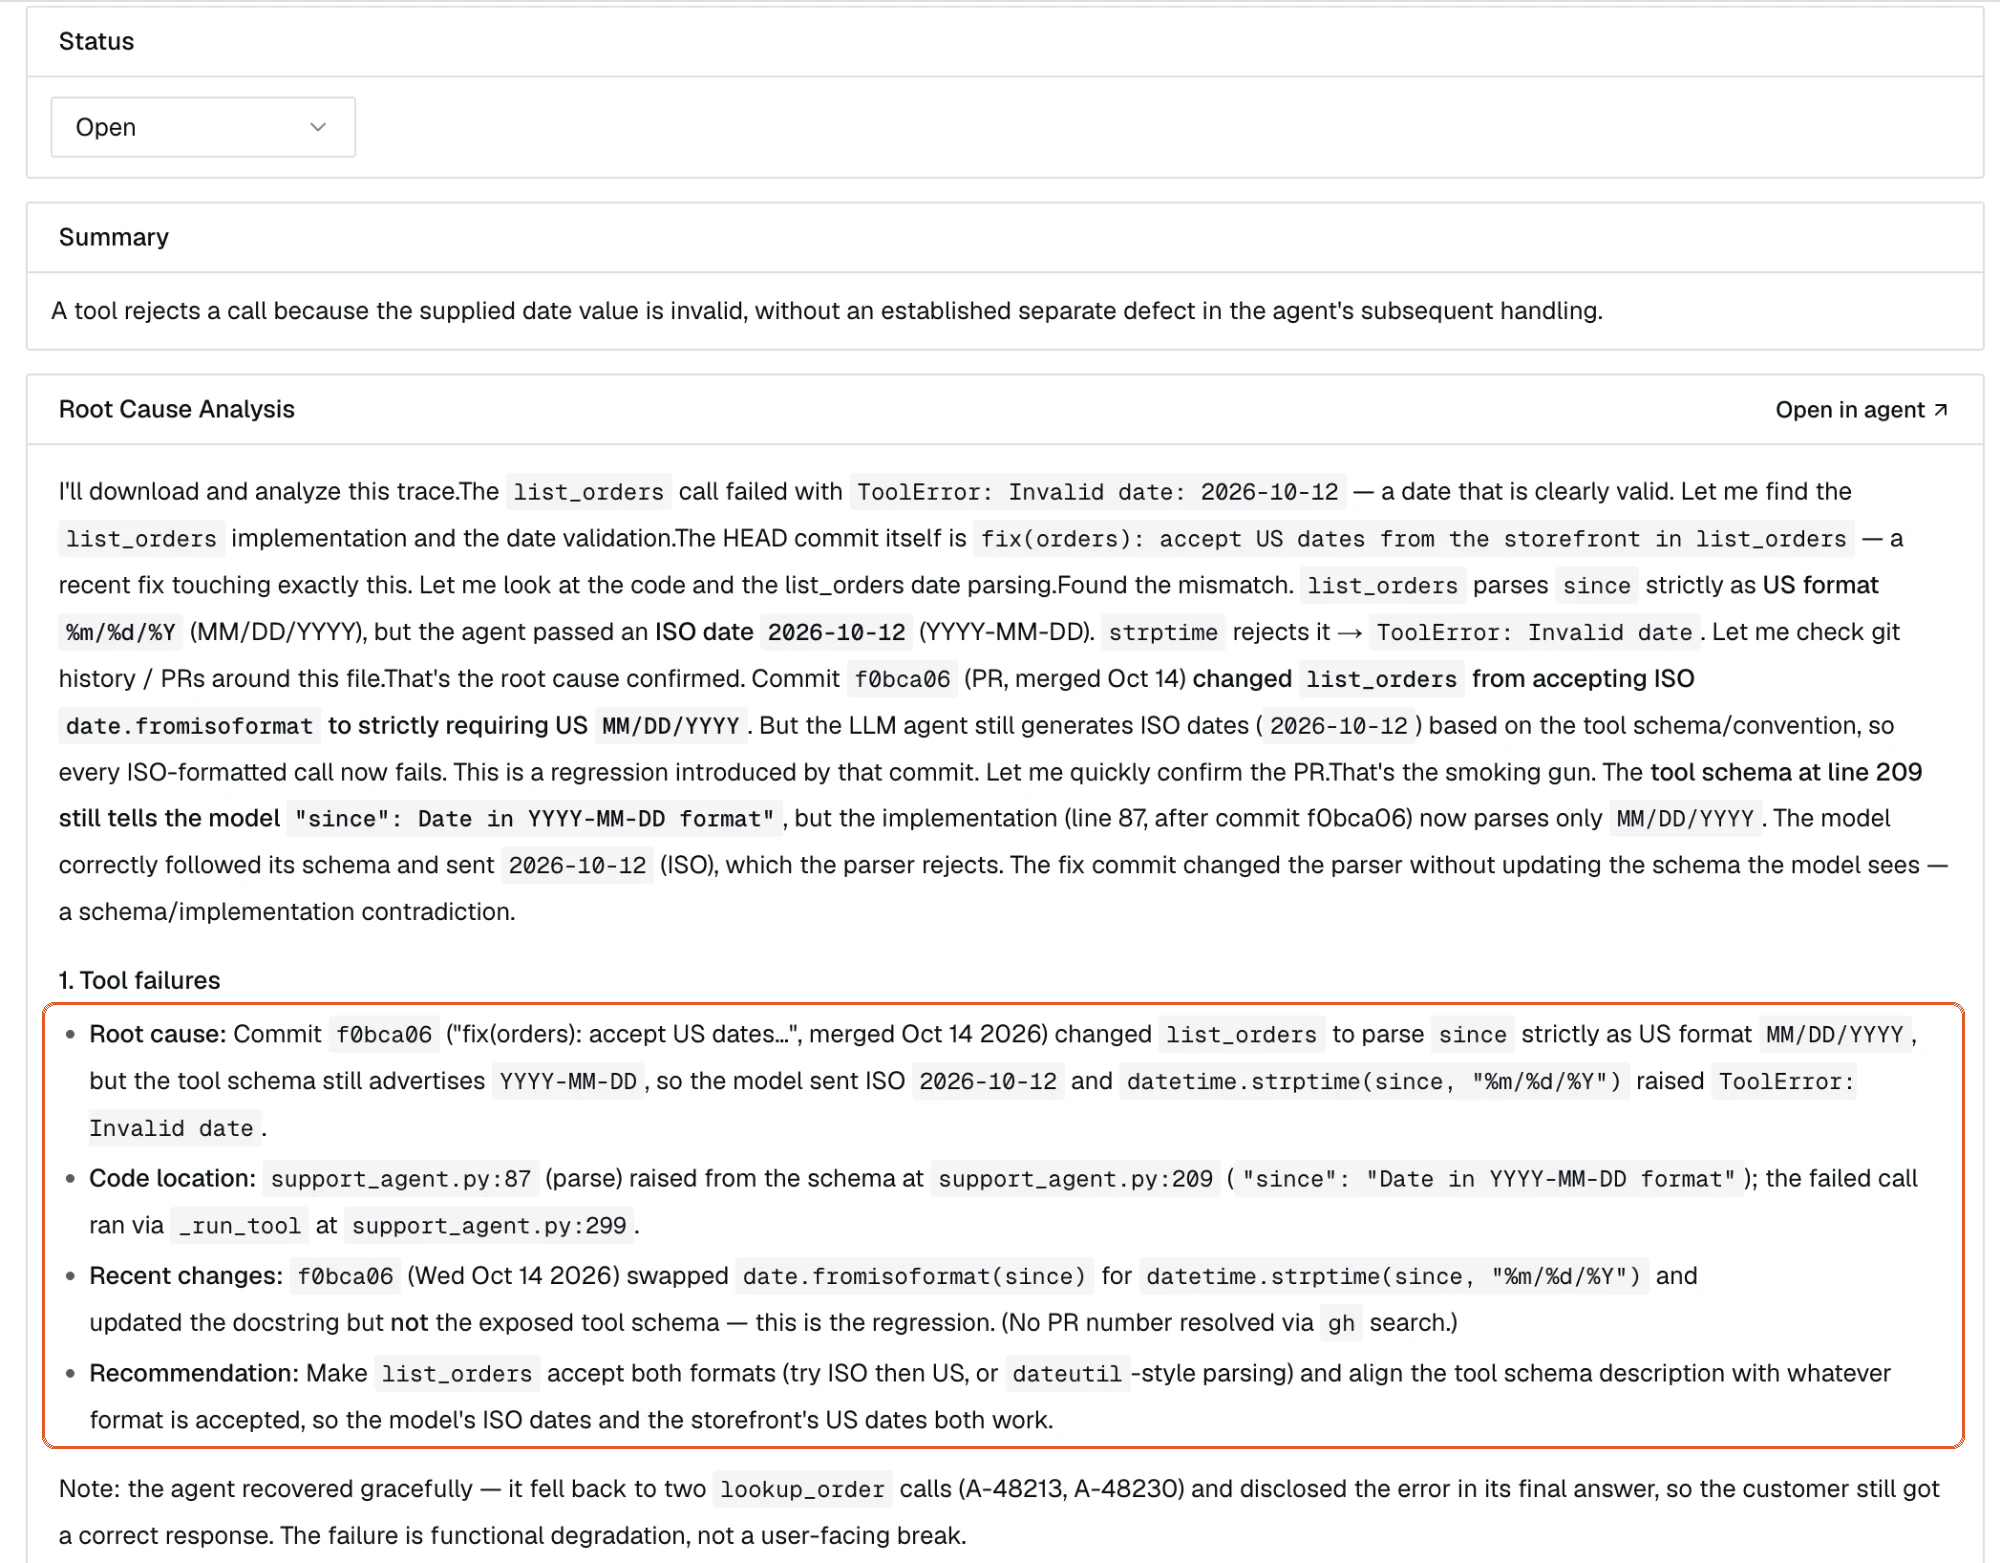
A pull request is optional. If you ask for one, the agent writes the fix and opens a pull request on a new branch through the GitHub App, linked to the trace, for an engineer to review. It never pushes to main. Root cause analysis is included in every plan: 30 runs on Free, 100 per billing period on Starter and Pro, and no limit when you self-host (Signals).
PostHog's loop runs through Self-driving. An agent investigates each report against your PostHog data and your codebase. When the report is actionable, an implementation agent clones your repository in a sandbox, creates a branch, writes the fix and opens a pull request. Pull requests are off by default, and you set the lowest report priority that opens one. The work is charged in AI credits at $0.01 each, with 1,000 credits in your first month and a default $150 monthly billing limit; past a limit, new signals are dropped rather than queued (Self-driving pricing).
A detector flags a trace, the trace joins a Signal, the agent analyzes the root cause against the repository at the traced commit, and can optionally open a pull request. A Resolved Signal reopens on regression.
| Dimension | PostHog AI Observability | traceroot |
|---|---|---|
| What the agent reads | Your PostHog data and your connected repository | Traces, plus a sandbox clone of your repository at the traced commit |
| Started by | An actionable report, or by hand | A new or reopened Signal, or by hand |
| Output | Report with evidence and priority | Root cause, code location, recommended fix |
| Pull request | Optional, off by default | Optional, on a new branch |
| Billing | AI credits, $0.01 each | A set number of runs included in each plan |
A CLI your coding agent can use
Both projects meet coding agents in the terminal. PostHog's wizard (npx @posthog/wizard ai-observability) installs the SDK and instruments your LLM calls, and the PostHog CLI exposes its agent tool catalog through a shell interface (CLI README).
traceroot setup signs you in, writes a project API key into your env file, has Claude Code or Codex add the SDK, and waits for the first trace. After that, the CLI is built around the improvement loop. An agent can list flagged traces, read one with its root cause analysis, and export a trace with its git context into the repository it is editing. It can run project-scoped, read-only SQL over spans and traces, and create, update and delete detectors, alerts, dashboards and projects. Every command takes --json, and exit codes are documented.
| Dimension | PostHog AI Observability | traceroot |
|---|---|---|
| Guided setup | npx @posthog/wizard ai-observability |
npx -y traceroot-cli@latest setup, with --resume |
| Skills for coding agents | PostHog skills | traceroot skills install |
| Judged traces | Evaluation results, stored as AI events | traceroot findings list and findings get, with root cause analysis |
| Trace export | Queries over ai_events |
traceroot traces export, with git_context.json |
| Read-only queries | SQL over ai_events in the SQL editor |
traceroot sql, SQL over spans and traces |
| Detectors and alerts as code | Evaluations from your own code through the API | traceroot detectors and traceroot alerts |
Pricing and retention
Self-hosting either project means paying for the machines it runs on. In the cloud, both meter events, but they count different things. traceroot Cloud counts a trace and each of its spans as one event, in blocks of 50k (usage metering). PostHog bills each $ai_ event as an AI Observability event (basics), and online evaluation results count as AI events too (pricing data). Plan details are from the traceroot pricing page and the PostHog AI Observability pricing page.
| Dimension | PostHog AI Observability | traceroot |
|---|---|---|
| Free | First 100,000 AI events a month | $0: 50k events a month, 15-day retention, 2 seats, 100 detector runs, 30 root cause analyses |
| Paid | Usage-based, from $0.00035 an event, falling with volume to $0.00006 | Starter, $30 a month: 150k events, $4 per 50k over, 30-day retention, unlimited seats and detector runs, 100 root cause analyses |
| Next plan | Add-ons: Boost, Scale, Enterprise | Pro, $200 a month: 90-day retention |
| Agent investigations and pull requests | AI credits, $0.01 each | Included in the plan |
| Prompt and completion content | 30 days | Plan retention: 15, 30 or 90 days, custom on Enterprise |
A worked example: an agent that runs 100 times a day, with 10 spans per run. Over 30 days that is 3,000 traces and 30,000 spans.
| Dimension | PostHog AI Observability | traceroot |
|---|---|---|
| Plan that fits | Free tier, $0 | Free, $0 |
At 1,000 runs a day, traceroot meters 330,000 events: Starter's 150k plus four extra blocks of 50k, or $46 a month. PostHog meters 300,000 events, 200,000 over the free tier, which is at most $70 at the starting rate. Evaluation results and Self-driving credits come on top on PostHog. On traceroot Starter, detector runs are unlimited and 100 root cause analyses are included.
Which should you choose
Choose traceroot if you want an open-source, self-hostable platform built to keep improving agents in production. Every span you send is kept, every trace carries the repository and commit that ran, detectors judge production traces on the server, flagged traces become Signals that reopen when a fix does not hold, and the root cause analysis agent reads your repository at the recorded commit, with a pull request one optional step away and a CLI your coding agent can drive. For a team that needs agent traces only, it is one product on one bill: at 1,000 runs a day, $46 a month on Starter against up to $70 for PostHog's AI events at the starting rate, before evaluation results and Self-driving credits.
Choose PostHog if you already use PostHog for product analytics and want each LLM trace tied to the user, their session replay and any exceptions, on the same platform as your feature flags and experiments.
Both accept OpenTelemetry, so the easiest way to decide is to send one agent's traces to traceroot next to what you run today.
Running traceroot next to PostHog
You do not have to switch in one step.
- Run
npx -y traceroot-cli@latest setupin the repository of one agent. Setup adds the traceroot SDK, which uses OpenInference instrumentors and records the repository and Git ref. - Keep PostHog running while you compare. Leave its SDK wrappers in place and add the traceroot SDK next to them, so the same agent reports to both.
- Write a detector for one failure you already know about, and connect the GitHub App so root cause analysis can read your code at the recorded commit.
- Compare what each tool tells you about the same failures for a week or two.
Get started
Install the CLI and run traceroot setup in the repository of one agent. Pick one failure you have already worked through by hand, so you know what a correct diagnosis looks like, then write a detector that describes it in plain language. The code is on GitHub.
FAQ
Is traceroot an open-source alternative to PostHog AI Observability? Yes. traceroot is open source and self-hostable. It keeps every span you send, judges production traces with detectors, groups flagged traces into Signals, investigates them against your repository at the recorded commit, and can optionally open a pull request for review.
Is PostHog LLM analytics the same as PostHog AI Observability? Yes. AI Observability is the current name, and PostHog's billing still lists the product under its original llm_analytics type "from before the AI Observability rename" (ai_observability.tsx).
Does PostHog record the commit on production traces? Not in its documented $ai_ properties. You can send repository and commit as custom properties. traceroot's SDK resolves the repository and Git ref and stamps them on every span.
Can I send OpenTelemetry traces to both? Yes. traceroot stores every span in the batch. PostHog's OTLP endpoint converts spans that carry gen_ai., ai., eve., traceloop. or pydantic_ai. attributes into $ai_ events and skips the others.
How is a traceroot Signal different from a PostHog report? A Signal collects the flagged traces from one detector as they arrive, and a Resolved Signal reopens when a trace that started after the fix shows the problem again. A PostHog report groups signals from Self-driving sources; once resolved it stays resolved, and a recurrence becomes a new report.
How does pricing compare? traceroot Cloud has a free plan with 50k events a month, and Starter is $30 a month for 150k events with root cause analyses included. PostHog AI Observability includes 100,000 AI events a month, then charges from $0.00035 an event, with Self-driving work billed in AI credits.
Do I need to give traceroot access to my repository? Only for root cause analysis and pull requests. Tracing works without it.
All PostHog facts were checked against PostHog's public documentation and repositories in November 2026. If something has changed, tell us on GitHub.