
Prerequisites
You need:- A project with incoming traces. See Tracing if you don’t have that yet.
- A Slack workspace connected to your TraceRoot workspace, with a destination channel selected. Slack is the only place alerts are delivered. See Slack delivery to connect it.
- Member access to the project. Viewers can see alerts but cannot create or change them.
Create an alert
Open your project in TraceRoot Cloud, select Alerts from the left nav, then click New Alert. The form has three sections on the left and a Live preview on the right.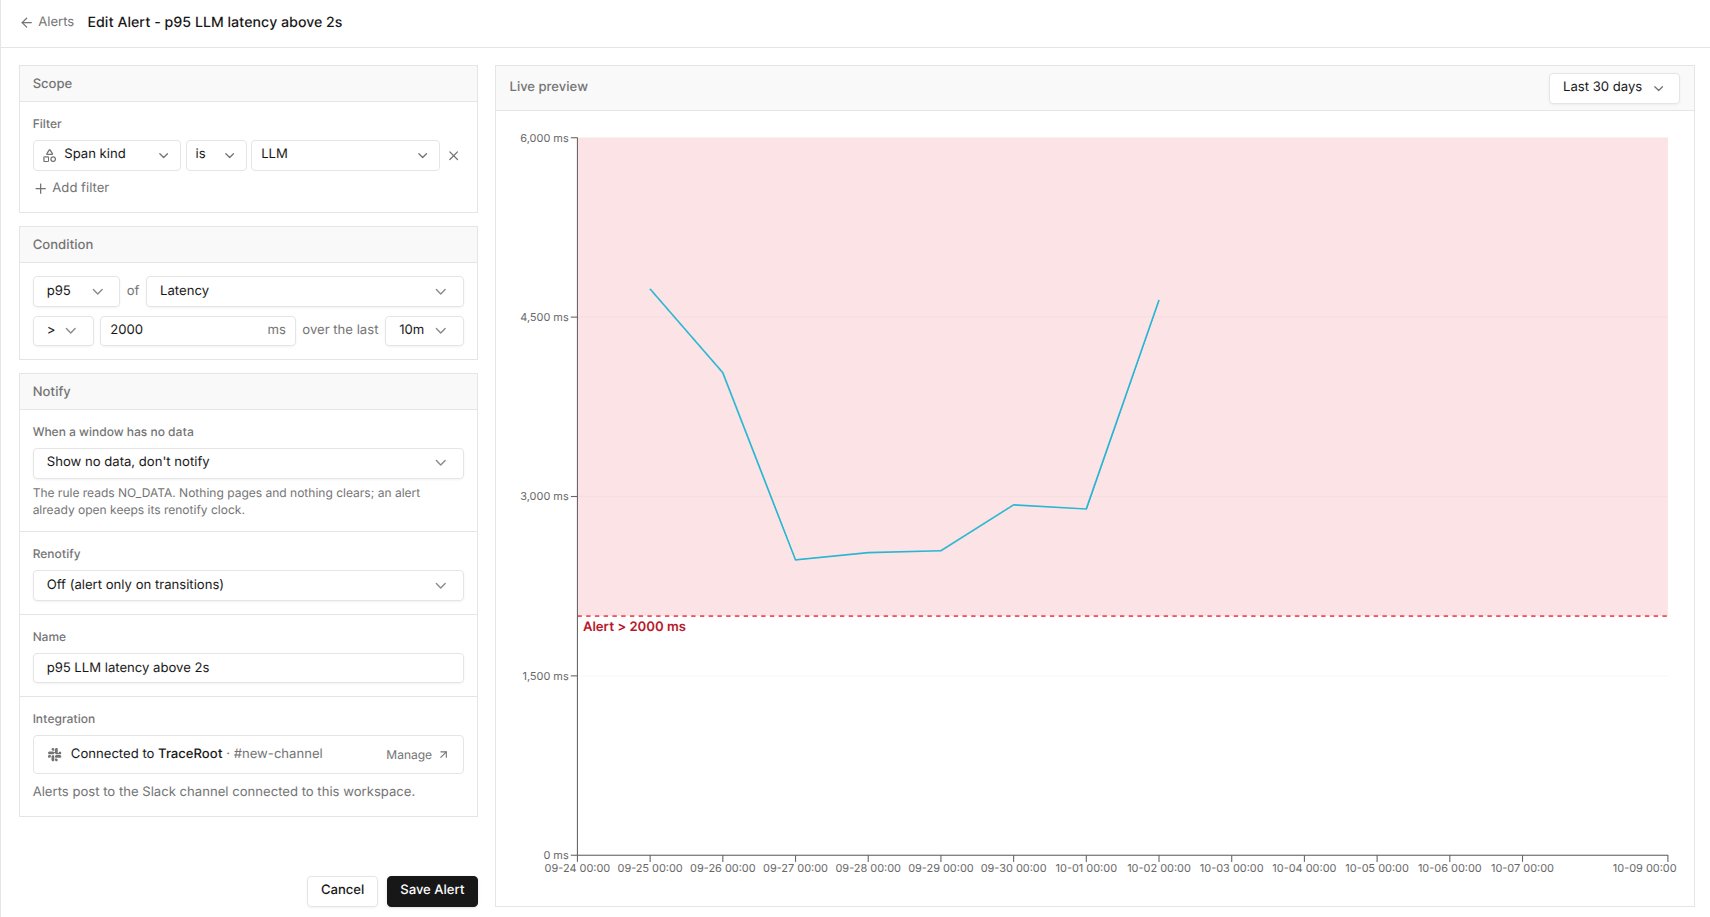
Set the scope
Under Scope, use Add filter to limit which spans are measured, for exampleSpan kind is LLM. Leave it empty to measure every span in the project. A metadata filter also needs a key. Half-filled filter rows are ignored.
Set the condition
Condition reads as one sentence: aggregation of measure, operator threshold, over the last window. For example,p95 of Latency > 2000 ms over the last 10m.
- Pick the aggregation and the measure. The aggregation list only offers what the selected measure supports: for example, Count takes only
count, and Latency takesavg,p95and the other numeric aggregations. - Pick the operator and enter the threshold.
- Pick the window: how far back each evaluation looks. The default is
10m.
The threshold field shows the measure’s unit:
ms for latency, $ for cost and tok/s for total tokens per second. A rule for “p95 latency over 2 seconds” uses a threshold of 2000. Token counts have no unit, and neither do the count and uniq aggregations. See the rule reference for every unit.Choose how it notifies
Under Notify:- When a window has no data: choose what an empty window means. The default, Show no data, don’t notify, sends nothing.
- Renotify: leave it Off (alert only on transitions), or choose Re-alert at a regular interval to repeat the message while the rule stays in breach.
- Name: how the alert identifies itself in Slack.
Check the live preview
The Live preview charts the metric as you edit, so you can tune the rule before saving it. Over a short date range each point is one of the rule’s windows; over a long range the points are coarser.- The threshold line is drawn across the chart and labelled with the trigger and its unit, for example
Alert > 2000 ms. - The shaded band marks the side of the line that breaches.
- The date range selector changes how much history the chart shows. It does not change the rule.
Read the Alerts list
Each row shows the rule’s latest state:- OK: the latest value is within the threshold.
- Alert: the latest value breaches the threshold.
- No Data: the latest window had nothing to measure, or the rule has not run yet.
- Failing: the last run failed and will retry next minute.
- Parked: the rule’s saved settings cannot be evaluated, so it has stopped. Edit and save the rule, or resume it, to start it again.
- Paused: evaluation and notifications are stopped until you resume the rule.
Manage alerts
Use the Actions menu on a row to pause or resume, edit, or delete a rule.- Pause stops evaluation and notifications. Resume starts the rule fresh: its state returns to No Data until the next evaluation.
- Edit opens the same form. Changing the filters, aggregation, measure, operator, threshold, window or no-data setting also starts the rule fresh. Renaming the rule or changing renotify does not.
- Delete removes the rule permanently.
Next steps
Rule Reference
Every measure, unit, aggregation, filter and state.
Slack Delivery
What each message contains and how to fix a failed delivery.